Mr. Tredinnick's Class Site
  • Home
  • Geography Courses
    • AP Human Geography
    • Biogeography
    • Cartography
    • Geographic Information Systems (GIS)
    • Global Studies
    • Human Geography (Tredinnick)
    • International Relations: World Environmentalism Focus
    • Marine & Freshwater Systems
    • World Geography
  • Geography4Geographers
    • G4G | Resources >
      • Human Geography Resources
    • G4G | Presentations >
      • Landscape of Remembrance
      • Teaching Geopolitics
  • Archived Courses
    • AP Comparative Government
    • AP European History
    • AP U.S. Government
    • AP World History
    • Art History
    • Behavioral Science
    • Economics
    • Environmental Policy
    • International Relations
    • Minnesota History
    • Psychology
    • Sociology
    • United States History
    • U.S. Government
    • World History (Fall Semester)
    • World History (Spring Semester) >
      • World History Summer Session
  • About

Welcome to Biogeography!

Picture
Biogeography deals with the spatial distribution of the planet's plants and animals over time, as well as the physical forces that impact them. Among others, biogeography draws from climatology, and ecology, to better understand the distributions and diverseness of the planet's organisms. The study of biogeography seeks to better understand distributions of species, and connections to the physical landscapes, as well as how humans influence these processes. Students will utilize local, and remote resources to better understand process such as speciation, adaptation, and the effects of change. Students will incorporate topics from biology, botany, and zoology under a geographic framework to better understand the connections that plants and animals have with the environment they live in. Using project-based methods of observation, data collection, and geospatial modeling, students will incorporate in scientific studies to better understand spatial distributions of the planets plants and animals.
Course Objectives
  • Understand the past and present forces that affect the process of speciation and dispersal of the planet's flora and fauna.
  • Incorporate scientific theories from the social and physical sciences to better understand the causes of plant and animal distributions.
  • Apply geographical inquiry and analysis skills to better understand biogeographical concepts from a spatial perspective.
  • Understand the issues affected future life on planet as a means for applying conservation and mitigation mindsets. 

Unit I | Physical Geography

To build up the foundations of the study of biogeography students need a foundation of study in physical geography. Students will be introduced to concepts from related fields such as climatology and earth science, that will be relevant in the following units. Time will also be taken to establish course procedures and expectations for the coming year to allow for the maximization of instructional time.

Unit I Schedule

Module 1.1 | Introduction to Biogeography
Introduction
​
Welcome to Biogeography. To answer your most basic question - the field of biogeography tries to explain why stuff lives where. Today's lesson will introduce some of the most basic principles of the class and give a preview of the types of things we'll be doing this year. 
​
Today's Objective
  • Students will be introduced to the general layout of the course and the expectations for the coming semester. Students will examine base concepts of biogeography and be able to apply its basic principles. 
    • Central Question: What is biogeography?
Today's Checklist
  • Complete Forum 1.1 | Factors Determining Life
    • What are five things necessary for lift to exist? List your answers in the form of complete sentences
  • Watch & Discuss: Where Life Lives
    • Follow along with the video Biogeography: Where Life Lives by NOVA and be ready to discuss answers to the two questions below;
      • What important questions is the study of biogeography trying to answer? 
      • ​How does biogeography compare to other sciences like biology or earth science?
  • Read & Discuss: Making a Career out of It 
    • Read over the Powerful Geography description for an Environmental Field. of your choice and be ready to explain how geography contributes to that field.
    • ​Review the Powerful Geography description for Biogeography. to learn more about how it is important in many fields. 
  • Complete Field Lab | Meeting the Ratites
    • We will head to the African Grasslands to observe the Common Ostrich (Struthio camelus). While you are there we will be answering the following questions;
      • DESCRIBE the features the ostrich have that enable it to live in its given range?
      • EVALUATE what about the ostrich prevents it from being able to extend its range into different biomes or different geographic regions.
  • Complete Map Lab | Ratites Geoinquiry
    • Use the maps and the information provided from the contextual information below to complete the series of questions regarding the distribution of ratites around the world. To complete the geoinquiry use the Ratite Distribution webmap (Ratites Distribution Map).
    • Context: The family of Ratites includes the species of Emu, Ostrich, Cassaway, Rhea, Kiwi, Elephant Bird (extinct), and Moa (extinct). Though varying in size the species within the ratite family share the characteristic of lacking an extended keel to their sternum. The keep typically acts as an anchor for the required wing muscles for flight, as these birds lack the keel they are flightless.
    • ​Thought Questions
      • ​​DESCRIBE four potential explanations for the distribution of ratites
      • EVALUATE which of you explanations above which seems the most plausible? Explain your reasoning. Cite specific evidence from the map, or a related text to support your explanation
  • Complete CFU 1.1 | Introduction to Biogeography
Looking Ahead
​
Next class will continue on with the base foundational knowledge of Biogeography and buildings a better understanding of what the field is. We will do this by looking at its origins and trying to understand more so how the physical and biological sciences are better understood within a geographic framework.
Module 1.2 | History and Philosophy of Biogeography
Introduction
A lot of early science was trying to understand and explain how the world got to be like it is now. Principles such as evolution, adaptation, distribution, things that are commonly rooted in biology, actually belong firmly within the field of biogeography. Many early naturalists, like Charles Darwin and Alfred Russell Wallace, were some of the ones that originate the ideas and concepts of biogeography. Today's lesson will further investigate some of these ideas and connect them to the study of biogeography.
Today's Objective
  • Students will be able to explain the scientific basis and philosophical understanding that form the foundations of biogeography and how scientific studies can be incorporated in.
    • Central Question: What are the major theories associated with Biogeography? What Scientists came up with those theories? How are they connected to the geographic study of plants and animals? Why might past scientific studies be important to the geographical distribution of plants and animals?  
Today's Checklist
  • Complete Forum 1.2 | Science and Geography
    • What types of quantitative and qualitative data might be helpful when conducting biogeographical studies? List 2 quantitative and 2 qualitative characteristics​Quantitative  - Related to a quantity, can be numerically represented    Qualitative - Related to a quality, looking at non-numerical characteristics
  • Review the History of Biogeography notes
  • Complete CFU 1.2 | History of Biogeography
Looking Ahead
​
Next class we will be getting you logged into ArcGIS for the first time and getting you to make your first map! We will be looking at the large geographical features that define the Earth and allow us to better talk about locations.
Module 1.3 | Biogeographic Realms
Introduction
​
It should come as no surprise that a lot of our conversations in this class will be connected to discussions of place. Today we're going to start building up your alphabet of geographic locations and really look at the connections between plants and animals based on their geographic locations (the so called biogeographic realms). 
Today's Objective
  • Students will examine the biogeographic realms and explore their placement and characteristics. Students will examine the spatial distribution of Biomes and their groupings into regions. 
    • Central Question: What is the connection between plants and animals with the climate and landscape? 
Today's Checklist
  • Complete Forum 1.3 | No two lands are the same
    • Guiding Thought Question: Even though two areas may be classified as the same biome why might they have such wildly different plants and animals? What factors will lead to different speciation? 
  • Complete Map Lab | Making Your First Map
    • One of the main resources that a biogeographer uses to communicate information about whatever they're studying is maps. You will be making a very basic map with multiple layers today to help you learn the basic physical regions of the world.
Directions
  • Log in to ArcGIS by navigating to https://www.arcgis.com/index.html.
  • Sign in using the credentials provided by the instructor.
  • On the main screen, navigate to the main map view by clicking on the Map option along the top bar. 
  • Take a second to familiarize yourself with the format of the webmap
  • Change the Basemap to the Imagery Background
  • Ocean Labels
    • Add labels to your map by selecting the Layers menu along the top bar
      • Open the Create Sketch Layer menu (title this layer "Labels")
      • Select the Text option in the map notes menu
      • Add labels for the 5 Oceans (Arctic, Atlantic, Pacific, Indian, and Southern) by clicking on an area and then typing the name of the Ocean. 
      • Once finished click off of what you were typing, then you can click back onto it to edit the symbology. Add a 1px halo in white around the lettering.
  • Continents
    • Open the Layers menu along the left side bar
      • Select the Add Option 
      • In the drop down menu change the search from My Content, into ArcGIS Online Instead.
      • In the search bar type "Continents" and search.
      • The first option should be correct, the World Continents layer created by Map Maker Add it to you map by selecting the + symbol.
      • Navigate to the Properties menu on the right bar.
        • Hover you mouse over the World Continents layer in the Styles tab
        • Change the attribute to add the Field as "Continent"
        • Ensure that each continent is displayed as a different color
        • Use the Sketch and Text option to add a label for each of the Continents.
  • Save the Map
    • ​Select the Save menu along the left bar (select "save" not "save as" you only ever use save as if you're wanting to create a new version of a map to create a different map)
    • Name the map "Basic Geographic Locations firstname_lastinitial"
    • Finish by selecting Save Map
  • Share the Map
    • Select the share option on the Left bar.
    • Choose to share to organization and then close the share menu.
    • Copy the URL form the top bar and post it into the CFU 
    • Your Finished map should look like this Example.
  • Complete Map Lab | Biogeographic Realms
    • Open up the Biogeographic RealmsLinks to an external site. webmap and answer the following series of questions using the map. Make sure you read the information in the splash page to help better understand the concept of biogeographic realms. Write the answers to the following questions in you notebook or notes app.
      • EXPLAIN - what the purpose of studying biogeographic realms is in your own words
      • IDENTIFY - What is the largest terrestrial biogeographic realm? (Terrestrial - Related to land surface, not ocean surface)
      • IDENTIFY - Which biogeographic realm is most of North America part of?
      • IDENTIFY - Turn on the Terrestrial Ecoregions layer by opening the layer menu in the top left and then checking the box in the pop-up menu. Which biome makes up the largest part of the Afrotropics Biogeographic Realm?
      • EVALUATE - Which two biogeographic realms appear to be the most similar in their make-up (in terms of which biomes are part of the realm).
  • Complete CFU 1.3 | Biogeographic Realms
Looking Ahead
​
Next class we will be investigating further into how the Earth got its shape and how that has affected the distribution of plants and animals as well. Jumping into the realm of the physical sciences, specifically geology, we'll look at the theory of continental drift and how an understanding of biogeography actually helped understand the evidence associated with the theory. 
Module 1.4 | Continental Drift
Introduction
​
By looking at how the Earth got its shape, we can better understand the forces that have influenced the distribution of plants and animals at present. Today's look will start at a large scale, looking at the continents and how they were formed.
​
Today's Objective
  • Students will examine the connections between the movement of the continents and the impact that has on the distribution of plants and animals. Students will be able to explain the mechanisms by which that happens, and the observations that led scientists to develop the theory. 
    • Central Question: How did the continents get their shape, and how does that impact the distribution of plants and animals? ​
Today's Checklist
  • Complete Forum 1.4 | First Law of Geography
    • Guiding Thought Question: Explain how Tobler's Law of geography will relate to the distribution of plants and animals around the planet's surface.
    • TOBLER'S Law: Everything is related to everything else, but near things are more related than far things.
  • Complete Map Lab | The Big Puzzle
    • Use the physical map of the world and answer the following series of questions in your notebook or notes app.​​
      • IDENTIFY - Which continents seem to fit together easily? As in, which continents seem to naturally fit in with one another?
      • EXPLAIN - Which continental plates or landmasses were the most difficult to determine how they linked together?
      • EVALUATE - Based on the Continental Drift theory which areas would you expect to be most similar to one another? (In terms of flora and fauna) Choose one continent and explain your answer using evidence from the map quest or the illustration below.
  • Watch & Discuss about Alfred Wegener's theories
    • Watch the video talking about Alfred Wegener and the development of the Continental Drift theory. As you are watching think about answers to the following questions;
      • ​How does this theory help demonstrate the continual development of scientific theories.
      • How does this theory connect to the developing understanding of the distribution of plants and animals?
  • Listen & Follow Along about the ideas and theories of continental drift
  • Complete CFU 1.4 | Continental Drift
Picture
Picture
Looking Ahead
​
Next class will continue the work into how the Earth got its shape, but at a smaller scale. We will be heading out onto Zoo grounds to be finding examples of the processes of geomorphology.
Module 1.5 | Geomorphology
Introduction
At a much smaller scale than the continental level (as connected to continental drift) there are many physical forces that are constantly shaping the planet we live on. Today's we'll be looking at these forces and trying to identify specific examples of each form.  
​
Today's Objective
  • Students will be able to explain the principles of erosion and how the earth is continually shaped. Students will take notes on the types of erosion and then conduct a map and field study to find evidence of different types of geomorphology
    • Central Question: Why is the earth's surface shaped like it is? What processes have caused it to be that way?
Today's Checklist
  • Complete Forum 1.5 | Earth as a Geoid
    • Guiding Thought Question: Why is it inaccurate to say that the Earth is a perfect sphere?
  • Review notes on Geomorphology
  • Complete Shape of the Earth Field Lab
    • Go out into the Zoo and find an example of one of the forms of geomorphology from the notes. Post your example in the Shape of the Earth. FlipGrid with a short description of how the specific form of geomorphology is represented. 
  • Complete Finding Evidence Map Lab
    • Use Google Earth (https://www.google.com/earth/Links to an external site.) to answer the following series of questions to find specific examples of geomorphology around the world. Then complete the thought questions related to the processes of change. Complete the questions in your notebook or notes app and be prepared to discuss. 
      Identifying Geomorphology
      Use the search icon (located second from the top in the sidebar) to search for for the different locations listed below and correctly identify the types of geomorphology that is taking place.
      • Identify which geomorphological process is most likely responsible for the shaping of the landscape around Tromsø, Norway (Use English spelling "Tromso")
      • Identify which geomorphological process is most likely responsible for the shaping of the landscape to the east of Moremela, South Africa
      • Identify which geomorphological process is most likely responsible for the shaping of the landscape at Delicate Arch, Utah
      • Identify which geomorphological process is most likely responsible for the shaping of the landscape at Kloof Corner Ridge, Table Mountain (Nature Reserve), Cape Town, South Africa
      • Identify which geomorphological process is most likely responsible for the shaping of the landscape of Tahiti and the surrounding islands of French Polynesia
    • Thought Questions: Thinking about Geomorphology
      • Which of the geomorphological processes can be the most helpful or harmful to humans within the span of one lifetime (about 70 years)? Explain your reasoning and give a real-world example to support your reasoning.
      • Explain how the process can be helpful or harmful to humans within one lifespan (about 70 years). Remember you are trying to explain how it is the MOST helpful or MOST harmful to humans.
      • Give an example of a real-world application (might require internet research) and explain how it has been helpful or harmful to humans.
  • Complete CFU 1.5 | Geomorphology
Looking Ahead
​
Next class will be a heavy notes day as we're looking at the processes of solar insolation and how they impact the climate and weather of the planet. This is foundational information to understand the concepts of climate and how they connect to the distribution of plants and animals around the world.
Module 1.6 | Solar Insolation
Introduction
​
All life on the planet is connected back to direct or indirect contributions of energy from the Sun. The distribution of that energy on the Earth's surface gives us our seasons, weather, and helps dictate what sorts of adaptations species will need in order to live in a specific area.
​
Today's Objective
  • Students will examine the effect the sun's energy has on seasonal variations, and the effect that a place's location will have on the amount of solar insolation it receives throughout the course of the year by completing a map lab and reviewing concepts through direct instruction.  
    • Central Question: How does a place's location on the planet affect the climate conditions it will experience throughout the year? (3.1.b)
Picture
Today's Checklist
  • Complete Forum 1.6 | The Sun's Powers
    • Guiding Thought Question: Compare the Climate Graphs below of Omaha, Nebraska (Left), and Honolulu, Hawaii (right). Identify which one experiences more variation in temperature and precipitation from season to season. Theorize the reasoning for this.
  • Finish the Solar Insolation Map Lab
    • Use the Net Radiation DatasetLinks to an external site. (alternative: Earth ObservatoryLinks to an external site.) provided by the NASA Earth Observatory to investigate the relationship between the time of the year and the amount of solar energy that different portions of the earth receive at a given time.
      (Note - When you open the link make sure that the last full year's data available is chosen to be examined - as in, if it is 2023 then choose to examine 2022's data)
      When you open the link take a second to examine the information available and identify the coloration on the map and how information is being portrayed on the map.
      Work with a partner to answer the series of questions below in your notebook or notes app.
      • During what month does the Southern Hemisphere receive the most direct energy from the sun?
      • During what month does the Northern Hemisphere receive the most direct energy from the sun?
      • During which months does the equator receive the most direct energy, giving the Northern and Southern Hemisphere roughly equal amounts of energy?
      • Do some internet research and figure out when the Winter and Summer Solstices are, and then the Autumnal (fall) and Vernal (spring) Equinoxes. How do they connect to your answers from questions 1-3.
      • How does the amount of energy an area receives from the sun help better explain the seasonal changes in temperature? Make sure you make specific mention of the solstices and equinoxes in relation to the hemispheres.
  • Participate in the Solar Insolation notes (Below)
  • Complete CFU 1.6 | Solar Insolation
Solar Insolation
File Size: 573 kb
File Type: pdf
Download File

Looking Ahead
​
Next class we will be looking at the impact that the sun's energy has on affecting the climate of the Earth in different locations. We will be looking at the difference between climate and weather, and how both are influenced by the sun's energy.
Module 1.7 | Climate
Introduction
​
Climate and weather are things that are being talked a lot about these days, but what are they really and why do we care? In terms of biogeography, what does it matter the temperature here and the precipitation there? Quite a lot in reality. This module will familiarize you with the components of both climate and weather and how geographers track their patterns over space and time.
​
Today's Objective
  • Students will examine the differences between weather and climate, and the implications for the distribution of life on the earth's surface. Students will be able to explain the distribution of climate systems around the planet's surface and the associated indicators that accompany those regions.  
    • Central Question: What correlation is there between climate, weather, and life? Why will a climate region provide such a stark contrast in life it is able to support? ​
Today's Checklist
  • Complete Forum 1.7 | Climate Systems
    • Read the description of climate dynamics in the article An Introduction to Climate Systems. (Princeton Press) and explain why climate dynamics are such an important topic of study right now, and the types of things that are studied as part of the atmosphere, hydrosphere, biosphere, cryosphere, and lithosphere (land surface).
  • Go Over the Tracking World Climate Zones Notes
  • Complete and Discuss the Reading Climate Charts Data Lab
    • Use the precipitation and temperature charts to answer the series of questions regarding the biodiversity and potential speciation for the given region. Make sure you are paying close attention to the graph's scales.​
      • 1. DESCRIBE the climate characteristics of Amman, Jordan over the course of the year.
      • 2.  EXPLAIN what types of plants and animals would you expect to live around Amaan based on the climate and precipitation charts above? Provide evidence from the charts above.
      • 3. DESCRIBE the climate characteristics of Dori over the course of the year.
      • 4. EXPLAIN what types of plants and animals would you expect to live around Dori based on the climate and precipitation charts above? Provide evidence from the charts above.
      • 5. DESCRIBE the climate characteristics of Ilulissat over the course of the year.
      • 6. EXPLAIN what types of plants and animals would you expect to live around Ilulissat based on the climate and precipitation charts above? Provide evidence from the charts above.
  • Complete CFU 1.7 | Climate
Picture
Picture
Picture
Looking Ahead
​
You will be completing another in-class mapping activity so make sure you have your fully charged device and your ArcGIS login information next class. We will be looking further at some broad climate classification systems. 
Module 1.8 | Geographic zones
Introduction
​
Regions are an important tool that geographers use to subdivide the world based on similarities. This helps with the communication of the concept of place, and aids in the ability to compare areas. This lesson will have students learning about some of the very broadest biogeographical regions we use by completing a mapping activity to become more familiar with the technology as well.

Today's Objective
  • Students will learn about the different classifications of regions as they apply to biomes and ecoregions by examining the importance of temperature and precipitation
    • Central Question: How can the geographic theme of "regions" be used to better understand the categorization of ecological areas? ​
Picture
Today's Checklist
  • Complete Forum 1.8 | The Value of Regions
    • EXPLAIN TO THE DEGREE that the human developed concept of continents makes sense in organizing the distribution of plants and animals around the world. Use the example of the the distribution of floral kingdoms as represented in the map below to help you with your answer. ​
  • Read about the Five Geographical Zones
    • Read the World Atlas article on the Five Geographical ZonesLinks to an external site. and come up with one to two sentence descriptions of the Five different regions described. Your descriptions should include where they are located, and what are their defining characteristics. Be prepared to share your descriptions with the class.
  • Make a map of the Five Geographical Zones
    • Description: Using your ArcGIS account you will be making a map of a number of different formal regions and some of the prominent physical features on the earth’s surface. You will be creating map layers using Map Notes. Directions on how to use map notes are listed below. (Feel free to edit the basemap as needed)
    • To make a map note you will need to follow these steps:
      • open up the Add menu along the top bar
      • SelectAdd Map Notes
      • Name the map notes layer something that corresponds with the information it will be showing
      • In map notes you can choose to add points (specific locations), polygons (areas), lines, and words
        • Layer 1 - General Reference LinesDirections: Create a map layer of lines that includes the following features.
        • Arctic Circle (Dotted Line - Color 1)
        • Antarctic Circle (Dotted Line - Color 1)
        • Equator (Solid Thick Line)
        • Tropic of Cancer (Dotted Line - Color 2)
        • Tropic of Capricorn (Dotted Line - Color 2)
        • Prime Meridian (Solid Thick Line)
        • Layer 2 - Geographic ZonesDirections: Using the World Atlas article on the Five Geographical ZonesLinks to an external site. and instructions from the teacher create a layer that includes the following features.
        • Northern Frigid Zone (Demarcation Line and Label)
        • Southern Frigid Zone (Demarcation Line and Label)
        • Northern Temperate Zone (Demarcation Line and Label)
        • Southern Temperate Zone (Demarcation Line and Label)
        • Torrid/Tropical Zone (Demarcation Line and Label)
        • Sub-Polar/Sub-Arctic Region (Label)
        • Sub-Tropical Region (Label)
        • Save Your Map ->along the top bar change choose theSave option. Give your map a title and then a couple of tags related to the information that is shown on the map. Once completed select ‘Save Map’ to finish.Your maps do not save automatically so save early and often!
          Share Your Map ->Once your map has been saved open the Share menu along the top bar. Change the share options so that anyone in your organization can access your map. Copy the map url that has been generated and submit the link in the submission form on the CFU.
  • Complete CFU 1.8 | Geographical Zones
Looking Ahead
​
Next class students will be out and about on zoo grounds working on their observational and descriptive skills. We're going to be continuing our examination of regions and their geographic distributions.
Module 1.9 | biomes and ecoregions
Introduction
​
Each place in the world has a certain feel about it. There is something that when you're there, you can just tell. That is the geographical concept of place. Today you will be incorporating in the Five Themes of Geography to better understand a biome of your choice, that we can use to start better understanding place, the biomes, and also using ArcGIS Storymaps as an organizational tool.

Today's Objective
  • Students will be able to identify characteristics of the physical landscape and how they are a reflection of its location on the planet. Students will practice identifying the principles of place, and complete an activity where they identify place characteristics and the impacts those characteristics have on sense of place. (3.1)
    • Central Question: What can you learn about a Place from "reading the landscape" to analyze it's human and physical characteristics? 
Today's Checklist
  • Complete Forum 1.9 | Identifying Place
    • Identifying the place characteristics at a number of different scales. We will first do a place analysis of Husavik, Iceland together as a class using this clip.
      City - Identify 3 defining human characteristics (significant landmarks, cultural traits), and 3 defining physical characteristics (climate, physical traits) of your home city.
      State - Identify 3 defining human characteristics (significant landmarks, cultural traits), and 3 defining physical characteristics (climate, physical traits) of your home state.
      Country - Identify 3 defining human characteristics (significant landmarks, cultural traits), and 3 defining physical characteristics (climate, physical traits) of your home country.
  • Participate in Sensing Place Field Lab
    • Description: You will be creating an ArcGIS StoryMapLinks to an external site. about a terrestrial biome of your choice. The first step will be going out into the zoo and collecting evidence to include into your StoryMap in the form of pictures and observational notes. You may choose one of the types of biomes below to create your StoryMap on. You will need to collect information using your senses of sight, smell, listening to collect as much information as possible that might be applicable to the actual biome (not the zoo). You need elements of the human and physical characteristics of the biome (again, not the zoo) that have been incorporated into the exhibit design. Be sure to take pictures as well that you can incorporate into the storymap.
      • Tropical Savanna: African Grasslands
      • Ice Cap: Penguins
      • Hot Desert: Dome (Top floor)
      • Temperate Forest: Swamp of Kingdoms of the Night
      • Highlands: Asian Highlands 
      • Tropical Rainforest: Madagascar, Jungle, Gorillas
      • Maine West Coast: Sea Lions
  • Make a StoryMap for Placing a Biome
    • Description: You will be creating an ArcGIS StoryMapLinks to an external site. about a biome of your choice. Create a storymap that includes the following elements
      • Place: Description of the physical and human characteristics of the biome. (Include at least one of your photos)
      • Region: Description of the biome as a region and its defining features.
      • Location: Description of where the biome is located around the world. (Will need to include a map)
      • Human-Environment Interactions: How humans have used the resources of the biome, and how they have had to adapt to live in the biome. (Will be found on the signs in each location, or will require online research).
    • Your storymaps will autosave. When you are finished you can publish your map in the top right of the window. Copy the URL along the top, that is what you will be submitting into your CFU.
  • Complete CFU 1.9 | Biomes and Ecoregions
Looking Ahead
​
Next class will be a heavy lecture/discuss based class as we look over the science and geographical considerations of climate change. We will have special focus on the implications on speciation for Climate Change as well.
Module 1.10 | Climate change
Introduction
Climate change is something that is being talked about quite a lot, but how can we see its presence around the world? And more importantly, in the context of this class, what impact does it have on the distribution of plants and animals around the world? This class will examine some of the underlying issues and look at how we're seeing evidence of drastic shifts in global climate.
​
Today's Objective
  • Students will examine the human and natural factors that affect the climate of the planet and participate in a discussion about the empirical evidence that supports a warming Earth model.
    • Central Question: To what extent are humans involved in the processes of climate change and how could we be affected?
Today's Checklist
  • Complete Forum 1.10 | Climates Always Change?
    • In the Comments section to the following post a number of people point out that if the hottest day ever recorded in Nebraska was in 1936 then that is evidence that it has always been hot and that climate change does not exist. EXPLAIN how you could respond to these sorts of comments and use actual facts in your explanation.
  • Listen and Discuss Observations of a Warming Planet Notes
  • Read article on Climate Change's effect on Species by IUCN
    • Read over the description by theInternational Union on the Conservation of Nature (IUCN) on Species and Climate Change. to focus on the implications of climate change for species distributions.
  • Complete CFU 10 | Climate Change
Picture
Looking Ahead
​
We're wrapping up Unit I fairly quickly here. Your first skills test will be two classes from now. You should be reviewing the materials covered over the course of the Unit I modules. Next class we will cover new materials on the geographic distribution of human activity, be ready to discuss!
Module 1.11 | human ecology
Introduction
Ecology is the the study of how organisms interact with each other. In this specific case, we will be looking at the way in which humans interact with the planet and how their actions can have an impact on the distribution of plants and animals. This is a very broad topic so we will be taking a very wide spatial scale of analysis. 
​ 
Today's Objective
  • Students will examine the impact humans have had on the environment by completing a map-quest in which they will need to identify an authoritative map and explain the spatial relationship it represents. They will then further understand thee ways that humans adapt to their environment, impact the environment, and are a reflection of the physical environment by completing a map analysis activity as notes.(3.5.a, 3.5.b, 3.5.c)
    • Central Question: How have humans impacted the environment and been affected by it?
Today's Checklist
  • Complete Forum 1.11 | A Spatial Impact
    • Conduct a web search to find a map that displays one one of the ways in which humans are having a positive or negative affect on the environment. Once you have found your map copy and paste the answer template below into your response and complete it for your map. Obviously take out the blank spaces and write in your own answers. Include as many of the prompted areas below as possible.

      The title of the map I found is ____________________
      I found this map at ________________(insert link)
      This map was made in __________________
      _______________ made this map
      The relationship that my map shows is that _________________
      The data used to make this map came from ____________________________
      I know this map is reputable because ___________________
  • Participate in the Human Reach Map Lab
    • Using the Human Reach StorymapLinks to an external site. students will be divided into different groups to plan presentations on their different assigned section. The different sections are; Density, Urbanization, The Earth at Night, Networks, and the Human Footprint. Students will need to be prepared to present on the following questions.
      • EXPLAIN what data is being presented in your section and how.
      • DESCRIBE any interesting spatial trends that are revealed by your maps. 
      • EXPLAIN TO THE EXTENT that your topic (human density, urbanization, light pollution, transportation networks, or human footprint) will affect the distributions of plants and animals.
  • Complete CFU 1.11 on Human Ecology
​Looking Ahead
​
Next class we will have our first Skills assessment. This test will cover the content and skills covered throughout the course of the unit. Make sure you review the notes, the map labs and other assignments. You need to have all of your CFUs complete by next class to receive full credit. After the test day the assignments will be worth 75% of full credit. Please get those in soon.
Module 1.12 | Unit I Test
Introduction
​
Welcome to the end of Unit I | Principles of Physical Geography. Today's Skills and Content Assessment will be a culmination of the topics covered this Unit in which you will need to be able to apply the principles covered throughout the modules connected to this unit. 
​
Today's Objective
  • Students will demonstrate their knowledge of concepts related to physical geography and their applications to biogeography by completing a summative evaluation of the unit. 
    • Central Question: How do the principles of physical geography apply to the study of biogeography? ​
Today's Checklist
  • Complete Unit I Skills and Content Assessment | Physical Geography (ARCHIVED)
Looking Ahead
​
Next class we will begin Unit II that examines the location of Biomes and the adaptations that species make in order to survive in those locations. We will be mapping next class so please bring your device that works best for that. It would also be a good idea to sign up for an IUCN Redlist Education Account.

Unit I Notes/Map Sets

Global Warming and Climate Change
File Size: 3779 kb
File Type: pdf
Download File

Unit I Review

World Physical Regions
File Size: 704 kb
File Type: pdf
Download File

  • Seasonality
  • Milankovich Cycles
  • Geographic Zones
  • Early Theories of Biogeography
    • Evolution (Darwin and Wallace)
    • Naturalists
    • Paradisical Mountain (Linneaus)
    • Buffon's Law
    • Uniformitarianism (Lyell)
    • Phytogeography
    • Island biogeography
    • Geospatial Biogeography
    • Continental Drift (Wegener)
  • Climate Change
    • Natural
    • Anthropogenic
  • Ecology
  • Themes of Geography
    • Place 
    • Region
    • Location
    • Human-Environment Interactions
  • Biomes
  • Climographs
  • Climate 
  • Weather
  • Solar Insolation

  • Biogeographic Realms
  • Vicariance
  • Dispersal
  • Species Energy Theory
  • Geomorphology
    • Aeolian
    • Fluvial
    • Hillslope
    • Igneous
    • Tectonic
    • Biological
    • Marine
    • Glacial

Unit I Resources

A Pyramid Map of the World's Biomes

Atlas Pro: What Are the 7 Realms of Biogeography
Cornell: Continental Drift Puzzle

Current Biology - Evolution: Flight of the Ratites

GDA2020 - Geocentric Datum of Australia 2020 
National Geographic Encyclopedia: Continental Drift
National Geographic: Five New Fossils Found in Antarctica

NovaLabs: Biogeography - Where Life Lives

Picture
Picture
Picture

Unit II | Habitats and Ecosystems

Students will be compiling knowledge through the first unit into a larger conceptual understanding of ecology and the ways that plants and animals interact with one another. Ideas such as human and climactic influences will be introduced in the context of understanding how they can affect base earth systems and, in-turn, species distributions. There will be a large focus throughout the course of this unit on the connections between physical geography and the locations of different organisms. ​

Unit II Schedule

Module 2.1 | Rules of Ecobiogeography
Introduction
Welcome to Unit II which focuses on Biomes and the Adaptations of Species to fit the physical environment. Today's class will introduce the generalities of Species Energy Theory, and then the theories of Bergmann and Allen in explaining species distribution. 
Today's Objective
  • Students will examine the connection between species adaptations and landscape by completing a mapping activity in which they will reflect on the principles of Bergmann and Allen. (3.1.b, 3.3.a)
    • Central Question: To what degree to animals have Spatial Connections to the landscapes in which they live?
Today's Checklist
  • Complete Forum 2.1 | Reflections of Landscape
    • Guiding Thought Question: Look at the picture of the species pictured to the left (you can click on it to enlarge it) and explain what type of environment this particular species is best suited for based on its adaptations. (Be sure to mention at least 3 specific adaptations)
  • Participate in Rules of Ecobiogeography Listen & Interact
  • Work on Testing Testing Bergmann and Allen Map Lab
    • Description: Complete the activity below to test the applications of Bermann’s and Allen’s rules to real-world situations.
      • Choose a particular genus or order of taxons to further study. Suggestions include Vulpes, marmots, rodents, etc..) Using ArcGIS, and the IUCN Make a map of the ranges of 4 specific members of the taxon. 
        For Each species include
      • Their range mapped as an “area” (best downloaded from the IUCN Redlist)
      • A Link to their IUCN Redlist Page.
      • A Picture of the species from the PhotoArk.
      • A description of their biome-specific adaptation
      • Once completed save and share your map to the organization and submit your map to the CFU and answer the reflection questions. 
  • Complete CFU 2.1 | Ecobiogeography
Picture
Looking Ahead
Next class will be a heavy notes day as we'll be looking at the types and distributions of biomes before getting in-depth with the different ecoregions.
Module 2.2 | Biomes and ecosystems
Introduction
​
In order to better learn about the biomes and ecosystems' distributions, we kind of need to know what the main classifications of biomes are. Today's lesson will focus on what the biomes are, what are their defining characteristics, and where they're located. 
Today's Objective
  • Students will be able to distinguish between the specific biomes, on the basis of precipitation and temperature characteristics as well as floral and faunal adaptations - and be able to use these understandings in the development of their unit portfolios. (3.2.a, 3.3.a)
    • Central Question: What is a biome and what distinguishes one from another?
Today's Checklist
  • Complete Forum 2.2 | Living the Easy Life
    • Why is an understanding of the physical landscape necessary to better understand the flora and fauna that inhabit an area? Give an example of a specific animal and how understanding the habitat better helps explain the behavior and physical characteristics of the animal.
  • Participate in the Watch & Discuss on the Globe's Biomes
    • We'll start our examination by watching the Youtube Video Biomes: The Living Landscape of Earth. We'll build off the concepts when we do the notes here next.
  • Cover the locations and distribution of Biomes in the Earth's Ecosystems and Biomes notes
    • As a Class we will be going over the Earth's Ecosystems and Biomes notes to gain an understanding of the distribution of different regions around the Earth.
  • Complete CFU 2.2 | Ecosystems and Biomes
Looking Ahead
​
Next class we're going to do a bit further dive into the tropical biomes of the world. Plan on going out, and it would be advisable to bring a device that can do more techy work.
Module 2.3 | The tropical biomes
Introduction
​
We're starting our region by region look at the biomes of the world by looking at the Torrid Zone and examining the Tropical Biomes located within it. We'll be looking to answer the Where are they? What are they? And how are species adapted to living in these particular regions of the world?
Today's Objective
  • Students will examine the physical systems that have led to the creation of different types of biomes in the tropical regions, with a particular focus on the forest regions, by discussing notes, and examining the role of species within the forests. 
    • Central Question: What are the different types of biomes in the torrid zone? What are their characteristics? And how are the roles of species shaped by different physical forces?
Picture
Today's Checklist
  • Complete Forum 2.3 | The Tropical Zone
    • Examine the chart above and EXPLAIN in your own words the role of winds in redistributing the Sun's energy around the Tropical Zone.
  • Work on and Discuss answers to the Torrid Biomes Geoinquiry
    • Description: For this activity you will be using the Torrid Zone Biome Composition. map to answer the following geoinquiry styled questions.
    • IDENTIFY the 5 biomes located within the Torrid Zone.
    • DESCRIBE the Temperature, Precipitation, and Seasonal Trends of each of the 5 biomes (there are some climographs available - but you may have to use the Climate Data Organizationa. website to find other pieces of information) 
    • DEVELOP a geographic Question (rooted in the questions of where? Why there? Why Care? - usually 2 of them together)
  • Discuss the different forestry zones and their significance in the tropical region
    • As one of the Largest and most prominent terrestrial ecosystems of the Torrid Zone, Tropical Forests. have a lot of influence on climate patterns around the world
  • Participate in the Everyone has a Niche Field Lab
    • Head to the Jungle and find two species (need to be different types - mammal, insect, bird, plant, etc...) and create an information sheet about your two species about the role that they play in their particular ecoregion (be sure to include what part of the world they are from). Make sure you include how they fit into the food web, and what is their role in maintaining a healthy ecosystem.  Make sure you get a good image and include a range map of the species to include as part of your info sheet.
      You will submit a link to your document as the first question in this class' CFU.
  • Complete CFU 2.3 | The Tropical Zone
Looking Ahead
​
We will continue looking at the tropical zone and further examine some of the species related issues and adaptations of tropical zone. 
Module 2.4 | Deforestation and range fragmentation
Introduction
​
In other classes I'm sure you've talked about deforestation and how its bad, but today we're going to be looking at the specific manner in which deforestation is happening and the doubly harmful effects of deforestation leading to range fragmentation. We'll be having you work on creating informational graphics that discuss the topic and the implications. 
Today's Objective
  • Students will be able to explain the effects of range fragmentation on biodiversity in the Tropical jungles and complete a infographic on the topic and be able to answer questions on the end of class CFU.
    • Central Question: How does range fragmentation affect biodiversity indicators in the Tropical Zone?
Today's Checklist
  • Complete Forum 2.4 | Forest Fragmentation
    • PREDICT the possible consequences of deforestation on animals who live in the area. List and Describe TWO possible consequences.
  • Work on putting together a creative infographic examining Range Fragmentation as a result of deforestation
    • Description: Read the Mongabay article Tropical forest fragmentation nearing ‘critical point,’ study finds. by Morgan Erickson-Davis. You will be making an infographic. using canva that includes the following topics below. If you need to go to the jungle to get photos to incorporate into your infographic please clear that with me first. You will submit the link to your canva creation as question 1 in the CFU.
    • Discussion of what is range fragmentation
    • A map showing the extent of deforestation
    • Description of the factors leading to deforestation and fragmentation
    • Explanation of the impact of range fragmentation on flora and fauna
    • Inclusion of specific relevant theories (percolation theory, climate change)
    • Major facts and statistics
    • At least two pictures
  • Complete CFU 2.4 | Splitting the Forest
Looking Ahead
​
We will be moving along to the Temperate zone and examining the biomes and biogeographical specific studies being done in those particular areas.
Module 2.5 | The Temperate Biomes
Introduction
​
Moving along to the the temperate zone, we will be looking at the locations of the different biomes in the mid-latitudes. We will be working with Storymaps again and get you more comfortable working with a myriad of data presentation. 
Today's Objective
  • Students will be able to explain the distribution and characteristics of different biomes and the adaptations of species as connected to the biome. 
    • Central Question: What are the different biomes located within the Temperate Zones and what are their unique characteristics and locations?
Today's Checklist
  • Complete Forum 2.5 | Immersive Experience
    • Use the 360 Images of Toadstool Geological Park. and the Wadi Rum. to answer the question below.

      EVALUATE What is the value of immersive media, like videos and imagery, in conservation work like trying to get people to care about ecosystems?
  • Examine the Temperate Biome Map Lab
    • Map Lab | Temperate Biome Map LabDescription: For this activity you will be using the Temperate Zone Biome Composition map to answer the following geoinquiry styled questions.
    • IDENTIFY the biomes located within the Temperate Zone.
    • DESCRIBE the Temperature, Precipitation, and Seasonal Trends of each of the biomes (there are some climographs available - but you may have to use the Climate Data Organizational. website to find other pieces of information) 
    • DEVELOP a geographic Question (rooted in the questions of where? Why there? Why Care? - usually 2 of them together)
  • Participate in the Biome Storytelling Field Lab
    • Description: Working in groups, you will create a Storymap that introduces the following features. Your storymap will be about one of the temperate biomes identified in the previous activity's map lab.
      • An immersive 360 video (either self-produced or through youtube)
      • A interactive webmap created using ArcGIS
      • 2 still images that represent the physical characteristics of the biome.
      • A climograph 
      • A list of conservation issues affecting that particular biome (at least 5 - with descriptions of the implications)
      • A Case Study of a bird, a mammal, a plant, AND a reptile or Amphibian (with Picture, description of adaptations to survive in biome) 
      • You will submit the url of your completed storymap in question 1 of the cfu
  • Complete CFU 2.5 | The Temperate Biomes
Looking Ahead
​
October 23rd (8:00-10:15 for Morning students) and October 24th (12:30-3:00 for Afternoon students) we will be headed to Glacier Creek Prairie preserve. Please start arranging transportation accordingly.
Module 2.6.a | Fire Ecology
Introduction
​
During this class we will focus on the processes of Fire Ecology as an important modifier of grassland and forest ecosystems in the temperate region. This will be a buildup to our field experience at Glacier Creek Prairie Preserve.
Today's Objective
  • Students will be able to explain the impacts of wildfires on the ecology of forest and prairie ecosystems. They will interact and discuss with videos, articles and a game to demonstrate the processes of fire ecology. Comprehension of topics will be demonstrated on the end of class CFU.
    • Central Question: How can the natural and unnatural process of wildfire have an effect on speciation?
Today's Checklist
  • Complete Forum 2.6 | The Dangers of Fire
    • Guiding Thought Question: Should humans intervene and interfere in natural events, such as wildfires, or should they allow them to take their course? Explain your reasoning.
  • Establish baseline knowledge through reading an article on Fire Ecology
    • Description: Read over the Knowledge Project's Article on the Ecology of Fire and come up with a list of 5 main ideas from the article. Be able to expand on them in class discussion. 
  • Watch and discuss issues related to two different videos
    • As a class we will be watching two videos. The first one is Why certain naturally occurring wildfires are necessary by TedX. The second video by Vox looks at How decades of Stopping Forest Fires made them worse. Be ready to discuss main ideas - particularly what did you find most surprising or interesting about each of the videos?
  • Play Prairie Protector game and discuss
    • Description: Open the Prairie Protector Website and read the introduction and complete the tutorial. Once you're done with the tutorial try to complete the Escalation and the Drought scenarios.
      While you're playing, think about answers to the following discussion questions.
    • Why is it important to manage invasive species of woody plants in a prairie ecosystem?
    • What types of things complicate efforts to manage invasive species?
    • What is the effectiveness of managing using fire as opposed to other management methods?
  • Complete CFU 2.6 | Fire Ecology
Looking Ahead
​
Next Class we will be meeting at the Glacier Creek Prairie Preserve. Morning students we will be meeting at the Glacier Creek Barn at 8:00-10:15 of October 23rd. Afternoon students will meet at 12:30-3:00 on October 24th. Here are the directions on how to enter Glacier Creek Download Glacier Creek. You will need to arrange your own transportation for this field trip. We will be joined by the government classes as well. 
Please complete Forum 2.6.b before arriving at Glacier Creek
Lesson Title | Prairie Management Plan
File Size: 162 kb
File Type: pdf
Download File

Module 2.6.b | Glacier Creek prairie preserve
Introduction 
Students will be examining the role of fire on biodiversity and the development of healthy grass ecosystems by visiting an active prairie restoration site and then making recommendations for the preservation and restoration of different prairie ecoregions. Through combining field exploration with scientific literature students will be able to look at practical applications of scientific studies in promoting biodiversity in prairie ecoregions.
​Today's Objective
  • Students will understand the role that fire ecology has in the shaping of landscapes and the management of invasive and native species and develop a management plan for a specific prairie ecoregion.
    • Central Question: How can fire be good for a grassland, and what effect do different prairie management techniques have on biodiversity
Today's Checklist
  • Complete Forum 2.6.b (BEFORE THE FIELD EXPERIENCE)
    • Use the attached FORM to complete a biodiversity survey in your own yard or a nearby public park. In the space below, describe the general level of biodiversity in the space you surveyed.
  • Participate in Glacier Creek Field Lab
    • Biodiversity Lab 
      Description: Use the form to complete a biodiversity at two different research plots at Glacier Creek, you will do two different observations at each plot for a total of 4 biodiversity surveys at the two different plots. You will complete the form for the first research plot (both observations) and submit it, then reopen the form to do the next observation at the next research plot (the next two observations)
      Form Link https://arcg.is/WfDym0

      Water Quality Lab
      Description: Use the form to complete water quality testing at Glacier Creek. You will only be doing testing at one site. At the site you will measure ph and nitrates using the test strips, and using dip nets. 
      Form Link https://arcg.is/nezOn. 
  • Complete CFU 2.6.b | Field Experience Debrief
Looking Ahead
​
Next class we'll be moving onto the frigid zone and looking at the biomes and biogeographical issues of concern there.
Module 2.7 | The arctic biomes
Introduction
Moving along to the last zone, we'll be looking at the Northern and Southern Frigid zones. We'll start with a map lab, same as with the Torrid and Temperate Zones, but then look at some of the specific human and environmental concerns of the region.
Today's Objective
  • Students will examine and be able to explain issues related to the Arctic and the Antarctic, and further dive into concerns related to the regions in their unit portfolio (3.3.a, 3.2.a)
    • Central Question: What is unique about the Tundra as a region, where is it located, and what issues is it facing due to the warming climate?
Today's Checklist
  • Complete Forum 2.7 | Bringing the Arctic Home
    • Guiding Thought Question: Write up an argument on why people here in Nebraska should care about what is happening in the Arctic. Make sure to thoroughly articulate your point.
  • Work on the Frigid Zone Math Lab with a partner
    • Description: For this activity you will be using the Frigid Zone Biome Composition map to answer the following geoinquiry styled questions.
    • IDENTIFY the biomes located within the Frigid Zone.
    • DESCRIBE the Temperature, Precipitation, and Seasonal Trends of each of the biomes (there are some climographs available - but you may have to use the Climate Data Organizational. website to find other pieces of information) 
    • DEVELOP a geographic Question (rooted in the questions of where? Why there? Why Care? - usually 2 of them together)
  • Individually review the Issues from the Polar Region notes and answer the thought questions in the daily plan
    • Read over and write down the notes from the Issues from the Polar Region note set. While going over the notes answer the following questions.
      • How are the Polar regions defined?
      • How does human activity differ in the Northern Frigid Zone compared to the Southern Frigid Zone?
      • Why is cooperation between countries so important in both zones?
      • Describe the ecological concerns most facing the Frigid Zones. 
  • Individually watch the video in the Permafrost as an Indicator of Climate Change video and answer the thought questions in the daily plan
    • Description: Watch the VICE episode on "This Climate Pioneer Is Trying To Stop The Arctic From Melting" while watching, answer the series of questions below. 
      Be able to explain
    • How is global warming connected to methane levels and why is this so concerning?
    • What permafrost is and how understanding it is vital to studying the effects of climate change in the Arctic.
    • How can the reintroduction of species help alleviate the effects of global warming on permafrost?
  • Complete CFU 2.7 | The Torrid Zone
Looking Ahead
​
Next class we're going to focus more on glacial ecology and the effect that ice can have on the formation and manipulation of the landscape.
Module 2.8 | Glacial Ecology
Introduction
​
The Frigid Zone is marked by the long scale presence of Ice, but ice is a volatile feature that changes and is influenced by a number of factors. Today's lesson will look at the structure of the cryosphere and then how that impacts floral and faunal distributions. 
Today's Objective
  • Students will be examining the cryosphere and its characteristics, and impact on the Earth's climate with a direct linkage to the distribution of plants and animals by participating in notes, watching a video on ice age biogeography, and reading summaries of specific scientific theories. 
    • Central Question: What affects the growth and depletion of the Earth's cryosphere and how does that affect planet speciation? ​
Today's Checklist
  • Complete Forum 2.8 | I-C-E Age
    • Guiding Thought Question: PREDICT how the development of an Ice Age will lead to speciation.
  • Participate in the Cryosphere and Glacial Ecology Notes
    • As a class we will be going over The Cryosphere & Glacial Ecology Notes. The focus will be to give an overview of the issues of the polar regions, and how humans are involved.  
  • Read the two articles on Ice ages and speciation and answer the descriptive questions
    • Description: Read the article by the Utah Geological Society Ice Ages: What are they and what causes them? and "Utah's Pleistocene Fossils: Keys for Assessing Climate and Environmental Change." Take notes on the major ideas included. When finished answer the following questions and be ready to discuss.
    • What is an Ice age and what causes them?
    • Why is an understanding of the cycles of Ice ages necessary to understand present and future trends?
    • How are the changes in glaciation reflected in the types of plants and animals that are found in a certain area?
    • How does glacier ecology contribute to the field of Biogeography?
  • Watch the Biogeography of the Ice Age video and discuss
    • Watch the Atlas Pro video on The Biogeography of the Ice Age and Develop 3 inquiry-styled questions that could lead to further research into the biogeographical distributions of Flora and Fauna as connected to Ice Ages.
  • Complete CFU 2.8 | Glacial Ecology
Looking Ahead
​
Next class we'll be further investigating the behavior of glaciers and Ice caps as connected to climate change. The class after that will be the end of Unit Skills and Content test that will cover the materials that we've talked about over the course of Unit II. 
Module 2.9 | Receading Glaciers Geoinquiry
Introduction
​
This lesson will wrap up the materials from this unit. Building off the ideas of the declining Cryosphere, we'll be using remote sensing and aerial imagery to look at the impact of climate on the size of glaciers in Iceland.
Today's Objective
  • Students will examine glaciers using historical satellite imagery and remote sensing to determine the actual effects of global warming. Students will analyze satellite images to determine how glaciers are changing and design an action plan to create a solution.   
    • Central Question: How can climate change's impact be measured over time using geospatial tools?
Today's Checklist
  • Complete Forum 2.9 | Glacial Maximum
    • Guiding Thought Question: Watch the video of the mass calving event in Greenland and come up with a reaction and explain why this is such a concerning thing to watch.
  • Participate in Measuring Climate Change Map Lab
    • Description: Using Google Earth you will be measuring global warming as it happens. Following the framework of investigation, work through the process of asking a question, collecting and analyzing information, and then designing a solution. 
      Step 1: Ask – How can we actually see the effects of climate change over time?
    • Based on what you know, what type of effect will global warming have on glaciers around the world?
    • Which areas will have the larger impact from global warming? Which areas may not be impacted as much?
    • Step 2: Acquire – What are glaciers and how are they connected to climate change?
      Watch the Video Climate 101: Glaciers by National GeographicLinks to an external site.  and answer the following questions.
    • What are the two different types of glaciers and where do they form? 
    • What impact do glaciers have on the landscape and why are they important?
    • How do glaciers act as an indicator of climate change? 
    • Step 3: Explore – Which areas are being most impacted by global warming?Use the Glacial Melt Time MachineLinks to an external site. to examine glaciers around the world. Watch the time lapses for each of the following glaciers and explain the general trends the glacier has been experiencing since 1984. 
      i. Breiðamerkurjökull glacier, Iceland
      ii. Chacaltaya Glacier, Bolivia
      iii. Columbia Glacier, Alaska, USA
      iv. Helheim Glacier, Greenland
      v. Himalayan Glaciers
      vi. Larsen Ice Shelf, Antarctica
      vii. Shirase Glacier, Antarctica
      Step 4: Analyze – What actual data is there that shows just how rapidly glaciers are retreating?
      Process
    • Open up ArcGIS
    • In the Search Bar in the top left type in Breidamerkurjokull to navigate to the Breiðamerkurjökull glacier in eastern Iceland
    • Along the top bar click the basemap option and choose the imagery basemap
    • Take a minute to navigate around the map and get a better sense of the glacier’s location as part of the Vatnajökull ice cap and the source of the Jökulsárlón glacial lagoon
    • Add the World Imagery (Wayback 2014-02-20) Layer to the Map through Map Contents
    • Trace the location of the face of the glacier as it was in 2014 by creating a Map Note and drawing it as a line
    • Turn off the Wayback Imagery to view the glacier underneath in modern Imagery. 
    • Draw another line for the modern extent of the glacier.
    • Take 10 different measurements of the distance between the 1984 line and the 2016 line and record your observations below to help calculate the average distance of retreat for the glacier. Once you have made your 10 observations record the mean. 
    • Breiðamerkurjökull Glacier Average Retreat
      Observation 1 __________ miles
      Observation 2 __________ miles
      Observation 3 __________ miles
      Observation 4 __________ miles
      Observation 5 __________ miles
      Observation 6 __________ miles
      Observation 7 __________ miles
      Observation 8 __________ miles
      Observation 9 __________ miles
      Observation 10 __________ miles
      Mean: __________ miles
      Step 5: Act – What can people do about it?
    • What is something that you can do as a consumer to help address the issue?
    • What is something you can do as a citizen to help address the issue?
    • What is something you can do as a part of your role as a student (now or in the future) to address the issue?
    • Choose one of the solutions above and plan out a 4-5 step process to actually implement your solution.
  • Finish CFU 2.9 | Receding Cryosphere
Looking Ahead
​
Next class we'll have the end of unit skills test which will cover the materials from throughout the course of the Unit. 
Module 2.10 | Unit II Test
Introduction
Welcome to the end of Unit II | Habitats and Ecosystems. Today's Skills and Content Assessment will be a culmination of the topics covered this Unit in which you will need to be able to apply the principles covered throughout the modules connected to this unit. 
Today's Objective
  • Students will demonstrate their knowledge of concepts related to habitats and ecosystems and their applications to biogeography by completing a summative evaluation of the unit. 
    • Central Question: How do the principles of physical geography apply to the study of biogeography?
Today's Checklist
  • Complete Unit II Skills and Content Assessment | Habitats and Ecosystems
Looking Ahead
We will start Unit III next class. Please be prepared to be out on grounds.
Unit II Review
  • Bergmann's Rule
  • Allen's Rule
  • Jordan's Rule
  • Climate
  • Climate Zones
    • Torrid Zone
    • Temperate Zone
    • Frigid Zone
  • Biome
    • Locations
      • Impact of Latitude and Elevation
    • Characteristics
    • Species Adaptations
    • Ecological Issues 
  • Ecosystem
  • Fire Ecology
  • Climographs
  • Glaciology
  • Biodiversity
  • Permafrost
  • Deforestation 
  • Range Fragmentation
  • Desertification
  • Koppen Climate Classification System
Unit II Resources
Picture
Picture
Picture

Unit III | Ranges and Distributions

Building off the fundamental concepts from Unit I and Unit II, Unit III goes more in depth into the principles of Biogeography with a focus in the concepts of Ranges. Developing the foundations of students understanding by examining the core concepts. This unit is will build knowledge on the fundamental concepts of biogeography and the methods used to examine species distribution. ​

Unit III Schedule

Module 3.1 | Mapping the range of species
Introduction
​
One of the main skills that biogeographers need is the ability to collect geographic data. Often, this involves field work and working with data to make visualizations of species' ranges using geographic data.
Today's Objective
  • Students will work through the process by which species range is plotted and mapped. Students will learn the various cartographic methods that are used to map out species, and then work through the process themselves in mapping out species around the zoo grounds.    
    • Central Question: How can biogeographers track and communicate where species are located?
Today's Checklist
  • Complete Forum 3.1 | Complications in Plotting Range
    • Guiding Thought Question: What do you foresee as the biggest complication in determining the range of a particular species and mapping it out?
  • Interact with the Notes on the types of Range Maps
    • As a class we will be going over the Visualizing Range notes as a means of familiarizing ourselves with the different types of ways that species' ranges are tracked and mapped.
  • Participate in Plotting Species Range Field Lab
    • Description: In the Desert Dome, you'll be working with a partner to map out the location for a grouping of species (reptiles, mammals, birds, plants) located in the Dome. You will need to make a Survey 123 (you sign in with the same credentials as your arcgis) and create a new blank survey. In your survey, include a space to be able to identify the species of animal (as a single text line), be able to drop a pin on the species' location (Map - be sure to turn on Use Device Location and ask for Location when answering the question), and be able to add a picture (Image). Once you have all these features publish your map and then in settings mark it so that the survey is public and can be accessed by anyone with the link. You will complete the data. PreMade Survey.
  • Complete CFU 3.1 | Mapping the Range of Species

Looking Ahead
​
Next Class we'll look at the connection between where species are able to be located, by further examining tolerance ranges. We'll use this as a means to better understand the historic ranges of species and what that tells us about the climate zones.
Module 3.2 | Tolerance Ranges
Introduction
​
We've looked at how we map ranges, now we're going to dive a bit more into why species live where they do.
Today's Objective
  • Students will be looking at a number of range theories and associated examples to apply the theories to real-life examples to determine their relevance. 
    • Central Question: What may cause a species to stay put, or decide to leave its traditional range?
Today's Checklist
  • Complete forum 3.2 | Reasons for Dispersal
    • DESCRIBE a reason why a species may shift their range and the possible impact for them doing so.
  • Participate in the Field Lab | Needs to Live
    • Description: Head to the Jungle and find a specific species to observe for this activity. While watching them, come up with a list of as many biotic and abiotic factors that determine and regulate the amount of that species that can live in an area.
  • Participate in Population and Tolerance Range Notes
    • Description: As a class we will be going over the Populations and Tolerance Range Notes.
  • Read article on Tolerance Ranges
    • Read the LibreTexts explanation of Tolerance Ranges of Species and be prepared to answer questions about the text on the end of module CFU.
  • Complete CFU 3.2 | Population Dynamics
Picture
Looking Ahead
​
Next class we'll look at how species interact with one another and how that further affects their ranges and distributions.
Module 3.3 | Species Relationsips and Interconnectedness
Introduction
​
We'll continue our look at the establishment of the range of different species, and look to see the different biotic and abiotic factors that affect where species can live over space and time.
Today's Objective
  • Students will be looking at a number of range theories and associated examples to apply the theories to real-life examples to determine their relevance. 
    • Central Question: What may cause a species to stay put, or decide to leave its traditional range?
Today's Checklist
  • Complete Forum 3.3 | Factors Leading to Range Changes
    • Guiding Thought Question: Use the idea of Tolerance Ranges from the homework article to explain why a species (such as a snow leopard) may suddenly migrate outside their typical range.
  • Participate in Field Lab | Suited for its Range
    • Description: Observe the Snow Leopard and the Amur Tiger in Asia Highlands and answer the following questions regarding their niche and range
      • Come up with 5 observations on why the snow leopard is so well suited for its environment. (Observe its physical and locomotive characteristics)
      • Compare the snow leopard with the Amur tiger and come up with three differences between the two big cats, include in your answer why there may not be a lot of overlap in the two ranges of the Asiatic cats.
  • Go over Limitations of Range notes
    • Description: As a class we will be going over and discussing the Limitations of Range notes.
  • Complete CFU 3.3 | Species Interrelations
Looking Ahead
​
Next class we'll be looking at distinctions of species ranges based on their distributions.
Module 3.4 | Endemism and cosmopolitanism
Introduction
​
We've discussed ranges, we've looked at things that affect species ranges, now we're going to be looking at specific classifications for species ranges and the reason for them.
Today's Objective
  • Students will learn about the differences in Endemic and Cosmopolitan Species by examining examples of species and looking at the modes through which the spread and the barriers that prevent further spread.  
    • Central Question: Why are some species spread out while others are concentrated?
Today's Checklist
  • Complete Forum 3.4 | Dangers of Distributions
    • Guiding Thought Question: LIST 5 of the biggest risk factors for species that have limited ranges.
  • Participate in Field Lab | Two of These Things are Just Like the Others
    • Description: As a class we will be going over the Endemic and Cosmopolitan Species notes and discuss.
  • Go over as a class the notes on Endemic and Cosmopolitan Species
    • Description: Head out into the dome and match up two different types of species (reptile, mammal, bird etc...) That have similar appearances and similar adaptations despite being completely different taxon. Take photos and attach them as replies to your forum.
  • Complete CFU 3.4 | Endemism and Cosmopolitanism 
Looking Ahead
​
Next class we're going to be looking at some of the physical and biological barriers that prevent the dispersal or extension of the ranges of different species. 
Module 3.5 | Barriers
Introduction
​
While looking at ranges it is important to study what causes the divisions and disjunction of ranges and what can prevent the spread of species from one area to another. 
Today's Objective
  • Students will be able to identify different biogeographical barriers and be able to explain the impacts of the creation of barriers on species by creating a story map as a case study about the DMZ.
    • Central Question: How do barriers affect species dispersal and survival?
Picture
Today's Checklist
  • Complete forum 3.5 | The Distribution of Species
    • Guiding Thought Question: How will species adaptation and specialization act as barriers to them expanding out of their ranges? ​
  • Participate in Ecological Barriers Field Lab
    • Field Lab | Ecological BarriersDescription: Head into the Kingdoms of the night swamp area and choose one species to further examine, come up with a list of all of the things that might prevent the dispersal of that species.
      When you get back, read the short piece on Ecological Barriers to dispersal and work with a partner to come up with a list of as many possible barriers that you can in 10 minutes.
  • Work on The DMZ Story Map
    • Description: You will be making a story map about the perceived ecological benefits and the possible harmful effects of extending the border wall/fence between South Korea and North Korea.  
      In your story maps include the following features.
    • Explanation of how the construction of the wall itself could be harmful
      • Include source and short discussion of reputability
    • Explanation of how the wall would act as a barrier to a specific species and why that could be harmful to them
      • Include source and short discussion of reputability
    • Considerations of how the wall could be built without a large negative impact on the environment
      • Include source and short discussion of reputability
    • Argument on why the wall would NOT be harmful to species in the area.
      • Include source and short discussion of reputability
    • A Case Study Species from the Korean Peninsula and an explanation of how the construction or presence of the border wall might affect them
    • You will submit the URL to your storymap as question 1 in your CFU
  • Complete CFU 3.5 | Barriers
Looking Ahead
​
Next class we'll be examining a specific case study with the Wallace Line.
Module 3.6 | Case Study: Wallace Line
Introduction
​
The idea of barriers was one of the things that inspired Wallace and Darwin to develop their theories of evolution and the connection between speciation and location. Today's we'll be further examining the theories of Alfred Russell Wallace and testing his idea.
Today's Objective
  • Students will be able to explain the ideas of the Wallace line and their applicability to understand biogeographical relationships. By completing a mapping activity of species ranges in Australasia students will test Wallace's theories against the known ranges of native species in the area.
    • Central Question: How can the Wallace Line be used to explain species distributions in Australasia?
Today's Checklist
  • Complete Forum 3.6 | The Contributions of Others
    • Guiding Thought Questions: Why is it valuable to study theories developed by past scientists, even through their theories may be incomplete or do not perfectly demonstrate relationships
  • Watch The Invisible Barrier video as an introduction to today's concepts
    • Description: Watch the PBS Eons video, The Invisible Barrier Keeping Two Worlds Apart and come up with 5 main ideas from the video and be prepared to discuss.
  • Participate in The Wallace Lab mapping activity
    • Description: Work with a partner to make an outline range map for each of the species below (can be very generalized and grouped of disjunct ranges) on ArcGIS using data from the IUCN Redlist website. Each species should be a different color (use the freehand mapnotes to draw the ranges). One partner should make the map, the other should be in charge of pulling up the range map data on the IUCN website. Your map will be submitted as question 1 of the CFU, once your map is completed you will work with your partner to answer the thought questions below.
    • Cats
      • Asiatic Golden Cat
      • Sunda Clouded-Leopard
      • Tiger (Panthera tigris)
    • Sun Bear
    • White Cockatoo  
    • Orangutan
      • Sumatran
      • Bornean
      • Tapanuli
    • Red Kangaroo
    • Agile Wallaby 
    • Proboscis Monkey 
    • Honeyeater Birds 
      • Rufous-throated Honeyeater, 
      • Guadalcanal Honeyeater
      • Scrub Honeyeater
      • Marbled Honeyeater
    • Birds of Paradise
      • Wilson's Bird of Paradise
      • Black Sickelbill
      • Glossy-mantled Manucode
    • When finished, draw a thick black line that separates any distinguishable regions that develop
    • Thought Questions
    • Answer the following questions after making your species range map.
      • What pattern emerges from the lines that you have drawn? Can you identify any
        groupings?
      • Given that these islands have similar climates and habitats, suggest an explanation (using the idea of dispersal) for why some islands have similar fauna while nearby islands have completely different fauna.
      • How might vicariance be used as an explanation for species ranges in Australasia? (from continental drift or from changes in sea level)
      • Read over the article from the Australian Broadcast Company and Explain to the Degree that your Dividing Line (the last element added to your map) aligns with Wallace's line
  • Complete CFU 3.6 | The Wallace Line
Looking Ahead
​
Next class we'll be expanding on the ideas of Wallace and ranges by further examining the subdiscipline of Island Biogeography
Module 3.7 | Principles of Island biogeography
Introduction
​
Island Biogeography is one of the main focus areas of biogeography and a lot of work is being done there. Today, we'll go over basic ideas and principles of the theories attached to the study.
​
Today's Objective
  • Students will gain a basic understanding of the importance of islands in their study of biogeography, and the type of work that is being done to understand them better.
    • Central Question: Why are islands such important fields of study?
Today's Checklist
  • Complete Forum 3.7 | Islands as Laboratories
    • Guiding Thought Question: Why would islands be such valuable places to study theories connected to biogeography? List and Describe two possible reasons.
  • Participate in Modeling Island Biogeography activity
    • Description: Read the Stanford Birds descriptive article on Island Biogeography. You are going to be making a visualization of the different relationships represented in the theories of biogeography. For reference on what a scientific model looks like, please see the linked wikipedia page. In your model, you need to include the following relationships listed below. Along with a visualization, include a one sentence explanation to accompany your visualization. You may need multiple visualizations to properly display all the ideas.
      • The effect of distance between islands, or between an island and the mainland on speciation
      • The effect of the size of an island on speciation
      • The effect of the geographic location of an island on speciation (may have to supplement in ideas from Species energy theory)
      • MacArthur-Wilson Equilibrium Theory of Island Biogeography (The connection between island biogeography and colonization and extinction rates)
      • Pictures of your visualizations will be handed in as question one of your CFU.
  • Discuss Everglades Island Biogeography example
    • Description: We will watch the video National Parks in the History of Science: Island Biogeography. Come up with discussion points, questions, points for clarification, and connections to the Modeling activity.
  • Complete CFU 3.7 | Principles of Island Biogeography
Looking Ahead
​
Next class we'll spend some more time looking at specific examples of Island Biogeography principles by examining the Galapagos, Channel Islands, and Madagascar
Module 3.8 | Case studies of island biogeography
Introduction
​
Island Biogeography has a robust and interesting list of case studies of different ongoing field research sites that are being used to further develop the body of knowledge related to the subdiscipline. Today we'll be looking at different sets of Islands and examining their importance to the field of understanding biogeography.
​
Today's Objective
  • Students will gain a basic understanding of the importance of islands in their study of biogeography, and the type of work that is being done to understand them better by focusing specifically with Madagascar.
  • Students will learn about isolation, area, and equilibrium theories as they relate to island biogeography by examining case-studies in a map activity and the biodiversity of Iceland.
    • Central Question: What factors impact biodiversity on islands? Why are islands such important fields of study in biogeography? ​

Today's Checklist
  • Complete Forum 3.8 | Climate Change and Island Biodiversity
    • Guiding Thought Question: Apply the ideas from the article "Vulnerability to climate change of islands worldwide and its impact on the tree of life." to explain why  island species especially are so critically endangered due to climate change.
  • Participate in Island Biodiversity Field Lab
    • Description: Visit the exhibit on Madagascar and answer the following series of questions related to its biodiversity.
    • How many of the Species highlighted in the Expedition Madagascar are described as "endemic" to Madagascar? (Total number and percentage)
    • Analyze the commonalities between the species that are endemic to Madagascar to explain why they have not expanded their range beyond the island.
    • Use the evidence from the first question to explain why might organizations like the OHDZ be so focused on preserving the biodiversity of an island like Madagascar?
    • Use the linked webmap (https://arcg.is/1vvqe9Links to an external site.) to predict three other major islands that are areas of focus for preservation. For one of those explain further why you think it might be an area of focus.
  • Work on the Map Lab testing different theories of island biogeography
    • Description: Answer the following series of questions related to Island Biodiversity and specific theories related to location, size, and relative isolation. Focus on the designated islands from the webmap (https://arcg.is/1HKaiP) to answer the questions.
  • Complete CFU 3.8 | Island Biogeography Case Studies
Picture
Picture
Picture
Looking Ahead
​
Next class we'll wrap up the unit's new materials by looking at Marine ranges and their uniqueness in the field of biogeography.
Module 3.9 | Factors affecting marine distributions
Introduction
​
Marine species present their own complication and unique biogeographical characteristics given that there are a whole other set of conditions they live in. 
Today's Objective
  • Students will be able to connect the idea of marine biogeographical realms to the ideas of biodiversity and endemism. Students will complete a map and field lab about the topic and test their ideas against collected data.
    • Central Question: How do Marine Realms differ from terrestrial realms?
Today's Checklist
  • Complete Forum 3.9 | Tracking Marine Species
    • DESCRIBE the largest complication you foresee in establishing the range of Marine species. Use the Whale Shark as an example for your discussion.
  • Participate in Marine Biodiversity field lab
    • Description: Head to the aquarium and come up with a general rule for the connection between location with adaptations and diversity.
  • Work with a partner to complete Marine Realms Map Lab
    • Description: Work through with a partner the discussion points below related to the distribution of marine species and the complications of plotting species ranges in aquatic environments. You will first be developing a theories of the effect of different geographic factors on speciation, and then analyzing charts and maps to test your theories. Contextualizing notes have been added to help understand the graphics. The full article related to this activity can be found at Costello, M.J., Tsai, P., Wong, P.S. et al. Marine biogeographic realms and species endemicity. Nat Commun 8, 1057 (2017). https://doi.org/10.1038/s41467-017-01121-2Download Costello, M.J., Tsai, P., Wong, P.S. et al. Marine biogeographic realms and species endemicity. Nat Commun 8, 1057 (2017). https://doi.org/10.1038/s41467-017-01121-2
      ASK: Theorize the Relationships 

    • What will be the effect of proximity to land on biodiversity and endemism of marine species?
      • Explain your thinking
    • What will be the effect of proximity to the equator on biodiversity and endemism of marine species?
      • Explain your thinking
    • What will be the effect of the size of a body of water on biodiversity and endemism of marine species?
      • Explain your thinking
    • What sort of species are going to be the most endemic? the most cosmopolitan?

    • ANALZYZE: Review the Data

      ​
Figure 1 Species Endemism per Marine Realm
Picture
Note | Endemicity The top 100 most-widespread species in 5° cells were comprised of 27% pelagic megafauna and 72% plankton; and in the seas and oceans were 46% fish and 23% other vertebrates (birds, mammals, and turtles), 14% zooplankton, and 10% phytoplankton (Supplementary Table 2Links to an external site.). The most widespread species, the planktonic foraminiferan Globigerinita glutinata Egger, 1895, was recorded in 589 (28%) of the 2065 c-square cells (Supplementary Table 3Links to an external site.). The proportion of taxa in more than 50 cells that were primarily benthic and pelagic was 3 and 17% respectively, further showing the more widespread distribution of pelagic than benthic taxa. Thus, species-rich benthic taxa such as arthropods and molluscs contributed most to endemicity (Table 1Links to an external site.).
There were from 192 (Black Sea) to 16,508 (tropical Indo-West Pacific) species per realm (Fig. 1Links to an external site.). The number of species unique to each realm ranged from 3 to over 4000 (Table 1Links to an external site.). Most of these species were arthropods (mostly benthic crustaceans), molluscs, chordates (mostly demersal fish), and cnidarians, followed by annelids (mostly polychaetes) and echinoderms. The species in the Baltic and Black Seas were freshwater and brackish tolerant. In the Mediterranean (15) and New Zealand (28) realms the proportions of nematodes and bryozoans were notably higher than elsewhere. There were on an average 4268 ± 132 and 277 ± 75 species unique to each of the biogeographic realms and ‘seas and oceans’, respectively (mean ± 95% confidence limits). This is conventionally reported as percent endemicity to adjust for species richness. The average percent endemicity was thus, 42% ± 5 (range 17 to 84%) and 11% ± 5 (range 0 to 41%) for the realms and seas, respectively. The realms with the highest percent of unique species were the Black Sea (84%), Red Sea (74%), Chile (68%), Inner Baltic Sea (63%), South-East Pacific (59%), Tropical East Atlantic, and Tasman Sea—New Zealand areas (57%) (i.e., realms numbered 2, 14, 25, 1, 10, 23 & 15), with ten between 40 and 47%, eight between 30 and 36%, and five ≤ 27% (Fig. 1Links to an external site.).
Figure 2 Identified Marine Realms
Picture
The biogeographic realms as numbered 1–30 in Fig. 1Links to an external site.. a Shows realms (denoted by solid lines) overlaid on the original 5o latitude-longitude cells. Realm boundary smoothing included following the Southern Ocean 10oC annual average sea surface temperature sub-Antarctic Front. b Shows the 1000 m depth contour as a dashed line
Note | 5° cells The biogeographic realms identified by the 5° cells were supported by the groups of seas (Fig. 1Links to an external site.) and added additional realms, especially in the open ocean, and including coastal areas of west and southern Africa, southern South America, and New Zealand (Fig. 2Links to an external site.). At the 1% level, seven biogeographic realms were distinguished: the freshwater influenced (1) inner Baltic and (2) Black Seas; (3) Arctic-temperate including the North Pacific, North Atlantic, and Mediterranean; (4) mid-tropical North Pacific; (5) south-east Pacific; (6) mid-Atlantic, Pacific, and Indian oceans; (7) Tropical west Pacific coast; and (8) Southern Ocean (Fig. 1Links to an external site.). The same analysis for pelagic-only species indicated only five biogeographic realms, comprised of (1) & (2) of the above together, and distinguishing (3), (4), (6), and (8). Analysis of the full data set further subdivided the realms to distinguish 30 biogeographic realms (Fig. 1Links to an external site.).

​
ANALYZE: Reflect on the Data 
  • What was the effect of proximity to land on biodiversity and endemism of marine species?
    • How closely did your theory relate to reality?
  • What was the effect of proximity to the equator on biodiversity and endemism of marine species?
    • How closely did your theory relate to reality?
  • What was the effect of the size of a body of water on biodiversity and endemism of marine species?
    • How closely did your theory relate to reality?
  • What sort of species are the most endemic? the most cosmopolitan? 


  • Complete CFU 3.9 | Factors Affecting Marine Distributions
Looking Ahead
​
We'll have the end of unit Skills and Content Evaluation next class. Please review materials from covered from throughout the course of Unit III. It will be stimuli-based short answer questions like previous examinations. 
Module 3.10 | Unit III Test
Introduction
​
Welcome to the end of Unit III | Ranges and Distributions. We will celebrate this occasion with your end of unit skills and content evaluation. Please take a moment to fill out the mid-course evaluation as well. 
​
Today's Objective
  • Students will demonstrate their knowledge of concepts related to biogeography and how they are connected to the physical landscape. 
    • Central Question: What is the relationship between biological species and their physical location? ​
Today's Checklist
  • Complete Unit III Test
  • Please do Mid-Course Reflection once finished with the Unit Exam
Looking Ahead
​
We've made it to the end of Unit III and the First Semester! When we get back from winter break we'll dive more into the distribution of species and look to see how genetics and fossil records can help us build a more complete record of the processes of vicariance and dispersal.

Unit III Review

  • Range
  • Distribution
  • Thematic Maps
    • Dot Maps
    • Outline Maps
    • Contour Maps
  • Population
  • Malthusian Theory
  • Ancestral Biota
  • Tolerance Range
  • Niche
  • Fundamental Niche
  • Range Limitations
    • Temperature
    • Precipitation
    • Soil Moisture
    • Light Saturation
    • Wind
    • Extreme Weather
  • Competition
  • Exploitation
  • Predation
  • Mutualism
  • Facilitation
  • Species-Energy-Theory
  • Wallace Line
  • Vicariance
  • Dispersal
  • Barriers
  • Speciation
  • Adaptations
  • Endemism
  • Cosmopolitanism
  • Source Population
  • Sink Population
  • Persistence
  • Provincialism
  • Allochthonous Endemism
  • Autochthonous Endemism
  • Disjunction
  • Convergence
  • Island Biogeography
  • Hutchinson’s Multidimensional Niche Concept
  • MacArthur-Wilson Equilibrium Theory of Island Biogeography

Unit III Resources

Picture
Picture
Picture

Unit IV | Evolution and Phylogeography

The ideas of life's origins have long been studies and debated. Biogeographers look specifically at the present and historical ranges of different species to help support different scientific theories. This unit will focus on the methodology used within a scientific framework to test different scientific models that explain the distribution and variation over time and space of the species present on Earth. ​

Unit IV Schedule

Module 4.1 | Deconstructing Fossil Records
Introduction
​
Welcome to the beginning of Unit IV | Evolution and Phylogeography. This unit will focus on what we can learn about the processes of speciation from pre-historic and scientific records.
The ideas of life's origins have long been studies and debated. Biogeographers look specifically at the present and historical ranges of different species to help support different scientific theories. This unit will focus on the methodology used within a scientific framework to test different scientific models that explain the distribution and variation over time and space of the species present on Earth. 
Today's Objective
  • Students will be able to explain how fossil records reveal records of historic biogeographic distributions by completing field and map labs and discussions related to present and historic species. 
    • Central Question: What do fossils tell us about past distributions and climates?
    • Geographic Practice: Collect data (including observations and measurements) about geographic phenomena, and/or gather existing data to help answer a question or solve a problem. 
Today's Checklist
  • Complete Forum 4.1 | Learning From the Past
    • Visit the informational page of animals that have been found to have been present at the Ashfall fossil site in Northwest Nebraska and theorize three different things that we can infer about the physical landscape of the area 12 million years ago. When finished, visit the geology page to check your answers.
  • Participate in Geological Record Field Lab
    • Description: Choose an animal from the Desert Dome to observe and research. Write up a paragraph encyclopedia entry that describes the environmental conditions of the animal and what we can learn about the physical environment from the presence of this particular species.
  • Work on Antarctic Discoveries and Fossils Labs
    • Description: Watch the Atlas Pro video "What's Under Antarctica's Ice Sheet" as a preview for the Map Lab
    • Description: Review the fossils that have been found around Antarctica of different species and summarize what their presence says about the climate history of the continent. Use this webmap of Antarctic Fossils to access which fossils were found where. For each fossil, do some reading online to establish the tolerance range for the closest living relatives, to figure out what the conditions of their environment were like while they were living there.
      Establish a timeline in order that includes

    • The name of the species
    • The tolerance of their closest living relative
    • What the presence of this species tells us about the history of that region of Antarctica.
    • Supplement materials from this map activity with materials from the British Broadcasting Company "Secrets of Antarctica's Fossilized Forests." and the British Antarctica Survey "Fossils from the Antarctic."
  • Complete CFU 4.1 | Fossil Records
Looking Ahead
​
Next class we'll be further studying the historical patterns of dispersal by looking at the Great American Biotic Interchange. 
Module 4.2 | The Great american biotic interchange
Introduction
​
Fossil records, and the date they show up in different places, can tell us a lot about the geological timeline of the Earth. Today, we'll be looking at one of the most influential periods to the present distributions of species, The Great American Biotic Interchange.
Today's Objective
  • Students will examine how changes in the geological landscape affect historic and present patterns of speciation by reading a brief article about the process which they will answer questions about on the CFU.
    • Central Question: How have geological changes affected speciation?
    • Geographic Practice: Identify geographic data that can help to answer a question or solve a problem.
Today's Checklist
  • Complete Forum 4.2 | The Interaction of Continents
    • EVALUATE: The effect of the development of a corridor on the species makeup of a particular area.

      Ecological corridors, or 'corridors,' are parts of the landscape that allow animals to move between larger areas of intact habitat
  • Work on Evidence of Dispersal and Vicariance reading activity
    • Description: Read the article Land Mammals and the Great American Interchange by Larry Marshall using the following methods. Your goal from this activity is to be able to explain the main ideas of the Great American Biotic Interchange and the evidence that supports the theory, and to practice your approaches towards reading academic articles. 
    • Lump Reader - For the Introduction (the first section - it is unmarked), South American Land Mammals, and Waifs and Walkers sections read them full on through and then write a paragraph summary of the ideas within. Rate your comprehension 1-10 (10 being the strongest)
    • Type A with a Highlighter - For the Filter Effects of the Landbridge and Faunal Dynamics sections underline important concepts as you read. Rate your comprehension 1-10 again
    • Margin Warrior - For The Success of North American Taxa section underline key points as you go along, and then write one sentence summaries of each paragraph in the margins of the article. Rate your comprehension 1-10 again
  • Finish CFU 4.2 | Biotic Exchanges
Looking Ahead
​
Next, we'll be looking at the evolution of species by further examining the Galapagos.  
Module 4.3 | the galapagos and studying evolution
Introduction
​
Evolution is a key biological process contributing to our understanding of the present assemblage of plants and animals but how does it work? And more importantly, how does geography affect these processes?
​
Today's Objective
  • Students will be able to describe how climactic and biological process affect the distribution of plants and animals by examining and analyzing data and case studies of evolution.  
    • Central Question: How is evolution affected by climate?
    • Geographic Practice: Identify problems or questions that can be addressed using geographic principles, models, and data; express problems and questions in geographic terms. ​
Today's Checklist
  • Complete Forum 4.3 | The Times they are a Changing
    • Guiding Thought Question: Describe the processes of Evolution. Be sure to explain how the ideas of time, space, and genetic fitness are involved in the process. Use the Felidae family (pictured) as an example of your description. ​
  • Participate in Reading Data Charts activity
    • Description: Look at the chart below that represent data collected on the Beak depths of finches located on Daphne Major (an island in the Galapagos chain) between 1976 and 1978. Based on the chart do the following things
    • Identify the problem that is being represented in the two charts below.
    • Create an Inquiry-styled question that could lead into a further investigation of the phenomenon being represented below.
    • Hypothesize what you would find explaining the change in beak depth from 1976 to 1978.
    • Identify three reputable sources that would help you answer your question. In APA Citation
    • Use the abstracts or information available to come up with a short explanation for the drastic change in mean beak depth between 1976 and 1978.
  • Watch the HHMI video on the Galapagos Finches and Discuss
    • Watch the video "Galapagos Finch Evolution" by HHMI Bio-interactivehttps://www.youtube.com/watch?v=mcM23M-CCog
    • Why are the Galapagos so fitting for the purpose of studying biogeographic relationships as opposed to other islands?
    • Explain the processes through which life grew to populate the galapagos islands. Why are the finches such as especially interesting case/example of island biogeography?
    • How do the islands differ and lead to the development of new species over space and time? (Explain for space and explain for time)
    • What can we learn about the speciation of the rest of the world by studying islands specifically?
    • How has the modern work of scientists like the Grant's helped to contribute to pre-established theories like Darwin's?
  • Complete CFU 4.3 | The Galapagos and Studying Evolution
Picture
Picture
Picture
Looking Ahead
​
Next class we'll be looking more at Darwin as a scientist, his route, and the data that he collected as a means of further understanding the distribution of plants and animals on our planet. 
Module 4.4 | the voyage of the beagle
Introduction
​
Charles Darwin is perhaps one of the most well known Biogeographers whose work helped develop a major part of the field. Today we'll look at the scientific process of collecting evidence and dealing with criticism from the scientific community. 
Today's Objective
  • Students will learn about the processes, ways to track, and evidence that supports the role of evolution in species distribution by completing a Map Lab looking at topics related to evolutionary biogeography. 
    • Central Question: What role does evolutionary theory have in the distribution of species?
    • Geographic Practice: Find and describe spatial and temporal patterns in data, or find data that matches a pattern, to help solve a problem or answer a question.
Today's Checklist
  • Complete forum 4.4 | Collaborating Evidence
    • Guiding Thought Question: Especially when dealing with scientific theory, why is the continued collection of evidence and observations going to be important in the defense, and continued understanding of a process?
  • Work on The Beagle's Path partnered map lab
    • Description: Explore the ideas and evidence that helped Charles Darwin create his theory of evolution. Students will search anecdotes and images of animals that Darwin experienced along his journeys on the Beagle to describe how species may have differentiated. Students will identify key assumptions of the theory at select points along the trip.
      ʅ  = an action you need to do
      ? = a question you need to answer
      i = an informational piece to help you as you go along.
      The Beagle's Path WebmapLinks to an external site.
      Section 1: What did Darwin See?ʅ Click the map URL link above to open the map.
      ʅ Click the button, Bookmarks. Select the option, Begins and Ends.
      ? How long was he on this trip? Hint: Click the start and end points of his journey. 
      ʅ Click the button, Measure. Measure the distance that Darwin covered over this journey. 
      ? Turn off journal highlights and turn on the biomes. Considering the path of the Beagle, what types of bioregions was Darwin exposed to on his trips? Click the land along the shore. 
      Section 2: How Does Plankton Demonstrate Natural Selection?i An early observation dealt with the species that Darwin caught while trying out a new plankton net.
      ʅ Click the button, Bookmarks. Select Plankton Diversity. Click the map pin.
      ? What do you notice about the life that inhabits the top few meters of much of the world’s ocean? 
      ʅ Zoom out and then click the marker near England.
      ? Which of Darwin's statements of natural selection are supported by this picture? 
      Section 3: How did extinct species inform natural selection theories?? Lyell was well known before Darwin; he championed the idea that species were immutable. What evidence helped Darwin refute this? 
      ? How did these extinct species help Darwin shape Lamarck’s ideas into his theory? 
      ? How did seashells prove Lyell’s theory of slowly changing continents? 
      Section 4: What role did tortoises play in Darwin's theory?ʅ Click the button, Bookmarks. select the option, Galapagos Tortoises.
      ʅ Click the Selected Journal points around this area.
      ? What animal started Darwin thinking about species diverging into separate lineages?
      ? What did the governor say to point this out? 
      Section 5: How does observation shape theory?? What experiences helped Darwin see what so many others did not? 
      ? What helps sharpen your mind for cross-checking explanations on how things work? 
      ʅ Explore the Selected Journal Highlights to find how other experiences supported Darwin's theory
  • Interpret the Letter from Adam Sedgwick to Charles Darwin
    • Directions: Read the letter from Adam Sedgwick to Charles Darwin about The Origin of Species and answer the following questions.
    • What is the author’s perspective?
    • Who is Adam Sedgwick?
    • How might Sedgwick's professional position affect its content?
    • How does the document’s language indicate the author’s perspective? 
  • Complete CFU 4.4 | Darwin's Evolution
Looking Ahead
​
Next class we'll be doing a case study and further examining the Canine family's evolution to determine how evidence of their lineage can help further develop our understanding of evolution.
Module 4.5 | the lineage of the wolf
Introduction
​
Through using the canidae family as a case study of evolutionary past and present we will be mapping out present and historic ranges to try and better understand the processes by which wolves and their relatives have come to inhabit the Earth in their present patterns. 
Today's Objective
  • Students will work through a mapping activity to learn about the diffusion of animals and how to trace their evolutionary paths from a common center. 
    • Central Question: What do different evolutionary paths look like and how can we map them?
    • Geographic Practice: Organize data and create representations of data to help solve a problem or answer a question. ​
Today's Checklist
  • Complete Forum 4.5 | Centers of Origin
    • Explain one of the things that will complicate determining a specie's Center of Origin. 

      Center of Origins: Geographic location from which a certain species expanded from. 
  • Work on The Lineage of the Wolf Map Lab
    • Description: Map out the current and historic ranges of the wolf and use them to figure out whether the wolf’s distribution is a result of dispersal or vicariance.
      Map out the Current Ranges of the following Canis sub-species: Side-Striped Jackal, Golden (common) Jackal, Coyote, Gray Wolf, Black-backed Jackal, Ethiopian Wolf, Red Wolf.
    • Search “Canis” in the IUCN Red List to find the species and then click on each one to bring up their data sheets which will include their ranges. Use a different color for each member of the wolf species and draw out their ranges or import them into a arcgis webmap.
    • Read over the articles articles below and map out the movements (do this as "map notes" with labels and approximate dates) of the subspecies of wolves and their ancestors as lines with arrows to signify direction on the webmap. The articles will use terms for geological periods and landforms that no longer exist that will require some additional internet research.
      • Illinois State Museum
      • Wolf Country
      • Prehistoric Canids
  • Discuss Canidae Dispersal questions
    • Description: For each of the vocabulary words below describe how the term can be applied to the evolutionary
      history of the Canis species and their ancestors. If you believe the term does not apply to the wolf or its
      ancestors then explain your reasoning.
      • Active Dispersal: The voluntary movement of a taxa from one place to another under its own force
      • Passive Dispersal: The movement of a taxa from one place to other under the force of some other physical or organic force (ie. Being blown by the wind with inability to change course or attached to the fir/feathers of another organism).
      • Jump Dispersal: An infrequent, but long-distance movement of an organism in a short period of time. (ie. Most seen in colonization of newly formed islands).
      • Human-Aided Jump Dispersal: The rapid diffusion (spread) of an organism from one area to another aided through the deliberate of non-deliberate actions of humans
      • Secular Migration: Gradual diffusion of species from one area to another over a long period of time. Often taking place over the course of many generations (sometimes hundreds), species adaptations along the way will lead to the diversion of individuals along the way who adapt and develop into genetically unique species.
  • Complete CFU 4.5 | Historic Distributions
Looking Ahead
​
Next class will be more genetically based as we seek to understand the historic lineage of species by looking at their common traits.
Module 4.6 | Understanding cladograms
Introduction
​
Evolution can be a tricky thing to study since we can't go back and watch the process through which it happened. Thankfully there are records of the trends and patterns of it that can be traced through the field of phylogeography. 
Today's Objective
  • Students will be able to explain the contributions of phylogeography to understanding of the distributions of plants and animals and be able to complete a data lab examining these relationships.
    • Central Question: How does genetics contribute to biogeography?
    • Geographic Practice: Identify data analysis strategies that can be used to help solve a problem or answer a question.
Today's Checklist
  • Complete Forum 4.6 | The Markers of Change
    • Predict how we're able to better understand present distributions of plants and animals using a phylogenetic lens of analysis
    • Phylogeography
      “A field of study concerned with the principles and processes governing the geographic distribution of genealogical lineages, especially those within and among closely related species.” (Avise 2000) 
  • Participate in the Phylogeography watch and discuss
    • Description: Watch the video on the relationship between genetics and geography (the field of phylogeography) and explain how knowledge of genetics is important for understanding species distributions. 
  • Work on the Evolution Lab by Nova
    • Watch the Intro video explaining cladograms and the evolution lab produced by Nova Labs. Try to complete all 6 missions of the evolution lab that explores the commonalities between different species.
  • Complete CFU 4.6 | Genetic Trackers
Looking Ahead
​
We'll be further examining cladograms and common ancestors. Please dress for the weather as we'll be on grounds.
Module 4.7 | clades of the amazon
Introduction
Constructing visual representations of how species are connected to one another, even within the same region, can be a very helpful way to sort species and find connections. Today we'll be looking at connecting the seemingly disconnected species of the Amazon regions of South America. 
Today's Objective
  • Students will be able to identify how genetics can help work as an identifier of evolutionary histories of species and create a cladogram representing the patterns of evolution for a region of the world. 
    • Central Question: What effect does physical location have on similarities and differences in species?
    • Geographic Practice: Organize data and create representations of data to help solve a problem or answer a question.
Today's Checklist
  • Complete Forum 4.7 | Most Like the Others?
    • Guiding Thought Question: Looking at the cladogram below answer the following series of questions.
    • Which species shares the most recent common ancestor with the Mink?
    • Who (if anyone) can be considered the outgroup (the species with the least common traits) of the cladogram below?
    • Is the American Badger more closely related to the Fisher or the Racoon? Explain your reasoning.
    • Explain how the concept of competition has contributed to the evolution of the Mustelidaes, despite the fact they can live in the same general geographic location. 
  • Work on Amazonia Cladogram Field Lab
    • Watch the youtube video below about what a cladogram is and what it tells us about the phlogeographic connections about the species from a certain area. Afterwards, we will be headed to the jungle where you will observe the following species (Some are not in the jungle) and begin contemplating how they are related to one another. You will construct a cladogram for the species of the Amazon and see how they are all linked together.   
    • Amazonian Species
      Maned Three Toed Sloth - Bradypus torquatus
      Jaguar - Panthera onca
      Giant Otter - Pteronura brasiliensis
      Scarlet Macaw - Ara macao
      Duellman’s Poison Dart Frog - Ranitomeya duellmani
      Brown Howler Monkey - Alouatta guariba
      Green Anaconda - Eunectes murinus
      Spider Monkey - AtelesCladogram Table - Copy the following table into your notebook and place an X in the box if the animal has the characteristic (Hint - Search the characteristic not the animal)
      Create your Cladogram for Amazonia
      Once you have completed the table, fill in the cladogram model below that has been adapted for these particular species. Copy the cladogram into your notebook and then place the species in the appropriate spots.
  • Complete CFU 4.7 | Constructing Cladogram
Picture
Picture
Picture
Looking Ahead
​
Next class we'll wrap up the cladogram and genetic phase of understanding species distributions. We will be headed out in the Zoo so please dress accordingly.
Module 4.8 | phylogeography
Introduction
​
Sometimes genetics are the only way to track the history of a species. Today, we'll further examine that, and some other phylogenetic phenomenon by examining the case study of Madagascar's lemurs.
Today's Objective
  • Students will be able to define concepts connected to genetic drift and be able to identify how those concepts affect speciation using lemurs in Madagascar as an example. Students will watch a video and then analyze data located in a research article for the impact of genetics in understanding diversity.
    • Central Question: What effect does physical location have on similarities and differences in species?
    • Geographic Practice: Identify data analysis strategies that can be used to help solve a problem or answer a question.
Today's Checklist
  • Complete CFU 4.8 | Tobler's Genetics
    • Guiding Thought Question: Connect Tobler's First Law of Geography (Everything is related to everything else, but near things are more related than distant things) to the idea of genetic diversity between plants or animals from the same family. 
  • Watch the Genetic Drift video and discuss
    • Description: Watch the video on Genetic Drift and be able to explain the following concepts.
    • Genetic Drift
    • Bottleneck Effect
    • Founder Effect
    • Impact of Population Size in Genetic Drift
  • Participate in Lemurs of Madagascar Field Lab
    • Description: Head down to Madagascar with your notebook and make a cladogram of the species of lemurs present. You will need to do this based off their perceived appearance and adaptations. 
  • Read the Article by Lei et al. and discuss importance of genetics to identifying new species
    • Description: Read over the article A New Species in the Genus Cheirogaleus (Cheirogaleidae) by Lei et al. (2015) and be able to answer the following questions.
      • How is geographic data used in the process of identifying new species?
      • How does genetic data contribute to the process of identifying new species?
      • How does Genetic Drift possibly contribute to the development of new species in Madagascar?
      • Explain how maps, photographs, charts, and writing all contribute to wildlife biology and the identification of new species.
  • Complete CFU 4.8 | Phylogeography
Looking Ahead
​
The next couple of classes we will be looking at mapping as a mechanism for tracking the history of species. Please bring your mapping device and mice to best participate.
Module 4.9.a | Panbiogeography
Introduction
​
Leon Croziat proposed a cartographic method for theorizing species dispersal patterns in the late 1950s. The field of panbiogeography combines a tradition of mapping with biological work to better understand species distribution and ranges.
​
Today's Objective
  • Students will learn about the processes of Panbiogeography by covering methodology in notes and then putting that into practice by completing a Panbiogeographic analysis of the Rhinocerotidae genus. 
    • Central Question: How can geographic analysis be used to discover spatial relationships between taxa?
    • Geographic Practice: Identify data analysis strategies that can be used to help solve a problem or answer a question. Find and describe spatial and temporal patterns in data, or find data that matches a pattern, to help solve a problem or answer a question. Construct an answer to a question or a solution to a problem using geographic principles, models, and data
Today's Checklist
  • Complete Forum 4.9.a | More of Biology or Geography?
    • Guiding Thought Question: Based on what you have seen from the study of Biogeography has it been more biology or geography? Or an equal combination of the two? Explain your reasoning. 
  • Read through Article and Textbook passages to define Panbiogeography
    • Description: Skim the attached article and answer the following questions
      Be able to define:
    • Tracks
    • Nodes
    • Baselines
    • Be able to explain:
    • What is panbiogeography
    • The usage and applications of panbiogeography
    • The controversy of applying panbiogeographic methods
    • Grehan, J. R. (2001). Guest Editorial: Panbiogeography from Tracks to Ocean Basins: Evolving Perspectives. Journal of Biogeography, 28(4), 413–429. http://www.jstor.org/stable/827391

      Additionally, you can read pages 13-16 of the textbook pages linked below;
    • Biogeography: An Ecological and Evolutionary Approach. C. Barry Cox,   Peter D. Moore, Richard Ladle,  ISBN 9781118968581, 9th Edition, 2016
  • Go over Panbiogeographic Methods notes
    • Description: As a class we will quickly review the Panbiogeographic Methods Notes.
  • Begin Panbiogeography Geoinquiry
    • Description: Open the attached instructions and follow the directions to complete the Panbiogeography Rhinocerotidae activity. NOTE: You will have this class and the next one to complete this assignment.
      Sample Map 
  • Complete CFU 4.9.a | Principles of Panbiogeography
Panbiogeography Rhinocerotidae
File Size: 151 kb
File Type: pdf
Download File

Looking Ahead
You'll have time next class to finish the Panbiogeography geoinquiry. You will also need to start preparing for the upcoming skills and content assessment.
Module 4.9.b | panbiogeography
Introduction
​
Today we'll wrap up the Panbiogeography geoinquiry and start prepping for the skills and content evaluation.
Today's Objective
  • Students will learn about the processes of Panbiogeography by covering methodology in notes and then putting that into practice by completing a Panbiogeographic analysis of the Rhinocerotidae genus. 
    • Central Question: How can geographic analysis be used to discover spatial relationships between taxa?
    • Geographic Practice: Identify data analysis strategies that can be used to help solve a problem or answer a question. Find and describe spatial and temporal patterns in data, or find data that matches a pattern, to help solve a problem or answer a question. Construct an answer to a question or a solution to a problem using geographic principles, models, and data
Today's Checklist
  • Complete Forum 4.9.b | The Mapping of Species
    • EXPLAIN the value of mapping the present range of species to understanding the processes of their speciation.
  • Finish the Panbiogeography Geoinquiry
  • Begin preparing for next class' Skill and Content Evaluation
  • Complete CFU 4.9.b | Panbiogeography of Rhinos
Looking Ahead
​
Next class you will have your skills and content evaluation covering the materials from this unit. It will be formatted similarly to other evaluations where questions will be short answer and based on a stimuli.
Module 4.10 | Unit IV Test
Introduction
​
Welcome to the end of Unit IV | Evolution and Phylogeography. We will celebrate this occasion with your end of unit skills and content evaluation. 

Today's Objective
  • Students will demonstrate their knowledge of concepts related to biogeography and how they are connected to the physical landscape. 
    • Central Question: What is the relationship between biological species and their physical location? ​
Today's Checklist
  • Complete Unit III Skills and Content Evaluation
Looking Ahead
​
We've made it to the end of Unit IV and will be moving along to Unit V. The next unit will focus on the importance of maintaining biodiversity and the delicate balance of ecosystems and how they can be thrown off by the addition or removal of species. 
Unit IV Review
  • Cladistics
    • Cladograms
    • Outgroups
    • Alleles and Inherited traits
  • Active Dispersal
  • Passive Dispersal
  • Jump Dispersal
  • Secular Migration
  • Bottleneck Effect
  • Founders Effect
  • Genetic Drift
  • Outgroups
  • Genetic Diversity
  • Phylogeography
  • Human-Aided Jump Dispersal
  • Evolution
  • Survival of the Fittest
  • Center of Origin
  • Panbiogeography
    • Nodes
    • Tracks
    • Baselines
  • Contributions of Genetics, Paleontology, Climatology, Geology, to understanding species distributions.
Picture
NCBI: Taxonomic Site Guide
Amoeba Sisters: Genetic Drift 
Open Yale Course: Island Biogeography and Invasive Species

Unit V | Maintaining Populations and Biodiversity

Circling back to an ecological biogeographic perspective, Unit V examines the relationships between species and how they are connected with each other it intricate webs. Combining in the theories of biogeography to add a geographic perspective to the biological study of life on Earth helps to better be able to explain the impact that place and location have on the present and past distributions of species. This, as a means to better theories potential paths towards the future. ​

Unit V Schedule

Module 5.1 | Biodiversity map lab
Introduction
​
Moving into Unit V, this unit will be looking at the importance of maintaining balance. Not only will we be looking at the impact on a region when a species is taken away, we will also look at what happens when a species is added.
Today's Objective
  • Students will be able to explain the importance of maintaining a healthy abundance of a diversity of species. 
    • Central Question: How do the presence of species affect the distributions of other species?
    • Geographic Practice: Evaluate one or more answers to a question or solutions to a problem using geographic principles, models, and data.
Today's Checklist
  • Complete Forum 5.1 | More predators, more problems?
    • Work with a partner (both of you will submit your list and the name of your partner) to come up with of a list of at least 3 benefits for a healthy abundance of predators in an ecosystem, and three negatives to an abundance of predators in an ecosystem.
  • Work through Investigating Biodiversity Map Lab
  • Analyze and compare Competing Role of Sharks activity
    • Read over the two commentary pieces below (Roff et al., 2016; Ruppert et al., 2016) about the role  of apex predators (sharks) in reef ecosystems. Answer the following questions in a paragraph-style write up that reviews the literature, and makes specific references to the data and arguments present in both articles. 
    • What are the authors' primary contentions? (Hint: they both do a better job summing up the other's views than they do summing up their own views)
      • Include references to the biological data they use to support their argument.
    • How do their claims conflict with one another? 
    • Roff G, et al. (2016) Reassessing Shark-Driven Trophic Cascades on Coral Reefs: A Reply to Ruppert et al. Trends Ecol Evol. 2016 Aug;31(8):587-589. doi: 10.1016/j.tree.2016.05.005. Download Roff G, et al. (2016) Reassessing Shark-Driven Trophic Cascades on Coral Reefs: A Reply to Ruppert et al. Trends Ecol Evol. 2016 Aug;31(8):587-589. doi: 10.1016/j.tree.2016.05.005. 
      Ruppert, J.L.W. et al. (2016) The ecological role of sharks on coral reefs: response to Roff et al.. Trends Ecol. Evol. 31, 586–587
  • Complete CFU 5.1 Introduction to Biodiversity
Looking Ahead
We will continue looking at the importance of balanced ecosystems and tie in the ideas of tropic cascades.
Map Lab | Investigating BiodiversityDescription: Explore the ideas of biodiversity by exploring this interactive mapLinks to an external site.. Students will identify biological factors that encourage speciation by examining centers of high biodiversity. Students will prioritize regions globally for conservation with maximum species and minimal cost to set aside.
>  = an action you need to do
? = a question you need to answer
i = an informational piece to help you as you go along.
Step 1: Engage | What does biodiversity look like?
? If you were invited to go on a big-game wildlife tour, what locations come to mind?
>Click the map URL above to open the map.
? Humans have made the most extensive use of the planet’s surface in the planet’s history. Which areas have lost the greatest amount of diversity?
>Click on these dark areas of the map to find out what biomes these areas represent.
? What ecoregions have we changed most extensively? 
? Why have we changed these particular areas so extensively?
>From the Details pane, click the button, Show Contents of Map.
>Turn off the Global biomes layer, by checking the box to the left of the layer name.
Step 2: Explore | How does speciation relate to biodiversity?
i Predation drives speciation in plants.
> Check the box to the left of the layer name, Vascular Plant Diversity.
? Where is the highest variety of vascular plants?
> Check the box to the left of the layer name, Flowering Pant Diversity.
? Why would flowering plants have subtle differences in distribution from other vascular plants? 
Step 3: Explain | Where are the hot spots for mammalian diversity?
> Click the check boxes next to the two mammal diversity layers.
? Where are the centers of highest mammal diversity?
? What mammals can take advantage of these big areas of flowering plants and trees? 
Step 4: Elaborate | What factors support predation?
? What places have you heard of that have a lot of predators in the wild?
? What is it about Africa that has allowed it to contain such a rich variety of large mammals? 
? Would this influence the numbers of mammalian carnivores?
Step 5: Evaluate | How does species density relate to species diversity?
? What are the species densities of all mammals in hot spot areas? (Hint: Use the legend.)
? How do these numbers compare to the mammalian carnivores? 
? Is that expected based on trophic energy availability? 
? Do the numbers of species act as a proxy for total animals? 
Module 5.2 | Balancing biodiversity
Introduction
Population data can be incredibly helpful in tracking and measuring how species interact with one another and the importance of maintaining populations for the purpose of ecosystem biodiversity. Today's case study will look at the delicate balance of preserving predators in the Isle Royale ecosystem to maintain ecosystem balance. ​
Today's Objective
  • Students will examine population dynamics by examining a case study of wolves and moose on Isle Royale and how one species can impact another, and how the removal of one can have a drastic effect on the landscape and potential ecosystem collapse.
    • Central Question: Why is it so important to maintain populations of all types of species?
    • Geographic Practice:  Organize data and create representations of data to help solve a problem or answer a question and Find and describe spatial and temporal patterns in data, or find data that matches a pattern, to help solve a problem or answer a question.
Today's Checklist
  • Complete Forum 5.2 | The Necessity for All
    • DEFINE the concept of Biodiversity and DESCRIBE the importance of maintaining biodiversity for ecosystem health.
      DEVELOP a pitch for a field lab to further examine these relationships.
  • Discuss The Planet's Biodiversity notes
    • As a class we will be going over and discussing the notes on The Planet' Biodiversity
  • Work on the Wolves of Isle Royale Data Lab
  • Complete CFU 5.2 | Importance of Maintaining Biodiversity
Looking Ahead
​
We'll be choosing one of your suggestions on the importance of biodiversity to complete a field lab so please dress for the weather. We'll also be further examining the potential impact of climate change on biodiversity.
Data Lab | The Wolves of Isle RoyaleDescription: For almost 60 years, scientists have been examining the relationship between wolves and moose on Isle Royale National Park in the longest continuous predator-prey study in the world. Moose likely came to Isle Royale, an island about 580 square kilometers in size in Lake Superior, in the early 1900s by swimming from the mainland. Without any predators around, the population shot up and then crashed in 1934 as the moose depleted the food available to them on the island. A wolf population was established on the island in the late 1940s, probably after crossing an “ice bridge” from the mainland. In 1958, scientists started monitoring the cyclical rise and fall of moose and wolf numbers, with one population influencing the other, but also responding to other factors, such as disease, tick outbreaks, severe winters, and immigrant wolves. The wolf population grew to as many as 50 individuals in 1980, and 24 wolves lived on the island as recently as 2009.
The number of wolves has steadily declined since 2009. In recent winters, few wolves have immigrated to the island, resulting in higher rates of inbreeding and accompanying higher wolf mortality rates. Climate change has resulted in a steady reduction in ice cover over the Great Lakes. Currently, the wolf population is down to two individuals, making their local extinction likely. Without wolves, the already-large moose population is on track to double in the next few years. The moose are likely to repeat the pattern from the 1930s, decimating their diet of native vegetation. The National Park Service will soon decide whether to introduce 20 to 30 new wolves to the island.
Picture
Record your observations to what is happening in the photo above.
Make a prediction as to what will happen next. What are the potential costs and the potential gains for each animal?
Picture
Record observations of one of the potential outcomes, based on the situation from the two images above. Again make predictions and make a cost benefit analysis for all animals (Note-about 94% of Wolf Moose encounters end with the Moose escaping).  
What effect do wolf populations have on moose populations? What effect do moose populations have on wolves?
Use the Wolves and Moose of Isle Royale page to develop a visual representation of the correlation between the two species on Isle Royale. Use different colors to represent each species (Lines or symbols) with the X axis representing Years and the Y Axis representing population. Start with initial populations of moose at 500, and an introduced population of 20 wolves.
Picture
Work with a partner through this Click and Learn Module by hhmi Biointeractive to explore the exponential growth model and the logistic growth model of population growth and answer the series of questions below
  • How does the Exponential model examine population dynamics? What is the relationship between an initial population and the per capita growth rate (r) over time (t)?
  • How does the Logistic Model represent population dynamics? How does it explain the relationship of a species at a given time (N(t)) as dependent upon the per capita growth rate (r) Euler's Number (e) and the carrying capacity for an ecosystem (k)?
  • Which model do you think is a more appropriate model to represent the relationship between the moose and the wolves on Isle Royale? What would happen to one species if you were to remove the other from the ecosystem?
  • What other factors need to be considered to factor in the calculation of wolf populations and moose populations on Isle Royale over time? Come up with 2 factors for each species. 
Module 5.3 | Climate Change and biodiversity
Introduction
Biodiversity is a delicate balance, made even worse by human actions. Today's lesson will look at one island as a localized case-study of the importance of protecting biodiversity and then use an example from Australia for a more global scale.
Today's Objective
  • Students will be examining how plants and animals are affected by human activities by examining case studies in California and Australia and be able to evaluate efforts to address the problem of biodiversity loss. 
    • Central Question: How is biodiversity loss connected to human activity and what can be done to slow the loss of biodiversity?
    • Geographic Practice: Evaluate one or more answers to a question or solutions to a problem using geographic principles, models, and data. ​
Today's Checklist
  • Complete Forum 3.3 | Removing an Element
    • Guiding Thought Question: Choose an animal of some type (reptile, bird, insect, mammal, etc...) and make a case for removing it from the planet. (NO CHOOSING HUMANS)
           Part 2 - Go on someone else's post and make a counter argument on why that species should be protected and kept.
  • Participate in Biodiversity field lab
  • Discuss the Island Fox situation after watching video
    • Watch the video on The Hopeful Story of a Doomed Fox by NPR's Skunk Bear productions and write a summary of how the loss or reintroduction of one species can reinvigorate or destabilize and entire region's wood web and biodiversity.
  • Read article on impact of climate change on biodiversity and discuss
    • Description: Read the attached article Climate change, biodiversity conservation, and the role of protected areas: An Australian perspective and answer the following questions.
    • DESCRIBE why biodiversity loss is so damaging 
    • DESCRIBE the processes that Australia are using to stem the loss of biodiversity. 
    • EXPLAIN the impact that climate change is having on biodiversity (be sure to include the mechanisms)
    • EXPLAIN the evidence linking human activity to biodiversity loss.
    • EXPLAIN TO THE DEGREE the effectiveness of the measures to decrease the loss of biodiversity.
    • Mackey, B.G, Watson, J.E, Hope G., and Gilmore, S., (2008) Climate change, biodiversity conservation, and the role of protected areas: An Australian perspective, Biodiversity, 9:3-4, 11-18, DOI: 10.1080/14888386.2008.9712902
  • Complete CFU 5.3 | Anthropogenic Biodiversity Loss
Looking Ahead
​
We'll be examining Trophic Cascades and the impact that losing one species can have on an entire ecosystem. 
Module 5.4 | Keystone species and trophic cascades
Introduction
​
The smallest change can have a huge impact, today we'll be looking at how the addition or removal of critical species can have reverberating effects throughout an ecosystem.
Today's Objective
  • Students will be able to explain the concepts of keystone species and tropic cascades and be able to construct a scientific model representing relationships between species with each other in a ocean habitat.
    • Central Question: How can the loss or addition of individual species affect the health of an ecosystem?
    • Geographic Practice: Organize data and create representations of data to help solve a problem or answer a question. ​
Today's Checklist
  • Complete Forum 5.4 | Lions and Tigers and Bears
    • Guiding Thought Question: Choose an Apex Predator (Lions, Tigers, or Bears) and explain the importance of preserving them for their respective ecosystem.
  • Participate in Trophic Cascades Discussion
    • Watch the Video "How Wolves Change Rivers" by Sustainable human and answer the following series of questions.
    • Based on the movie come up with a general definition for a Keystone Species
    • Explain how the wolf is used as an example of a Keystone species and how its reintroduction to Yellowstone had effects as such.
    • Watch the video "How Whales Change Climate" by Sustainable Human and answer the following series of questions.
    • Based on the movie come up with a general definition for a trophic cascade
    • Explain how whales can create a natural trophic cascade using the example from "How Whales Change Climate"
  • Construct model of importance of Corals in Field Lab
    • Description: Head to the aquarium and create a model about the importance of corals in the ocean ecosystem. Your visual diagram will be submitted as question 1 for the CFU. Your model should include how the loss of corals would create a tropic cascade and how it would affect the following species
    • Small fish
    • Crustaceans
    • Charismatic Megafauna (Sharks and Rays)
    • Sea Turtles
    • Humans
  • Complete CFU 5.4 | Keystone Species and Trophic Cascades
Looking Ahead
​
Wait for it!!!! It is finally here, next class we will be tipping our cap to the heroes of humanity and examining the role of environmental engineers to the creation and preservation of habitats for others. Be proud!
Module 5.5 | Environmental Engineers
Introduction
​
Students Unite! Today we embark upon the great crusade which we have strive these many month. Finally, we pay homage to the selfless saviors, the environmental engineers. The heroic actions of these brave and noble creatures help others, and can literally save the world. Oh captain my captain, here we go!
Today's Objective
  • Students will rise to their feet in raucous celebration to learn about the noble ecowarriors we are honored to share this planet with. By focusing on ecosystem engineers and developing models about their impact on an environment students will weep with joy as they salute these fine selfless heroes.  
    • Central Question: What are environmental engineers and how do they benefit ecosystems?
    • Geographic Practice: Identify data analysis strategies that can be used to help solve a problem or answer a question. Inform or persuade an audience using geographic principles, models, and data. 
Today's Checklist
  • Complete Forum 5.5 | Saviors of Society
    • Guiding Thought Question: Beavers are seen as a pest species in the midwest choose an argument from Pheasants Forever and further explain why we should be welcoming beavers from an ecosystem perspective.
  • Participate in Protectors of Paradise field lab
    • Description: Head down to the swamp section of kingdoms of the night and come up with how the presence of beavers benefits all of these other groups of species (provide examples)
    • Insects
    • Fish
    • Other mammals Carnivores
    • Other mammals herbivores or omnivores
    • Amphibians
    • Reptiles
    • Birds
    • Plants (aquatic)
    • Plants (land-based)
    • Soil
  • Construct model of impact of wetland warriors
    • Watch the video produced by Utah State on Partnering with Beavers and develop a visual model representing the importance of beavers to an ecosystem. While watching the video make a list of all of the ways that beavers benefit an ecosystem (both locally and globally and both natural and human landscapes), and then make a model that represents these benefits. 
      Bonus Video: Beaver Drop
  • Analyze data collection techniques in Mapping Magicians
    • Description: Read through the article EEAGER: A neural network model for finding beaver complexes in satellite and aerial imagery and answer the following series of questions.
      DESCRIBE why scientists are so interested in understand the distributions of beaver activity across a landscape.
      EXPLAIN how the following systems are incorporated in studying beaver activity.
    • Geographic Information Systems
    • Aerial Imagery
    • Artificial Intelligence 
    • Fairfax, E., Zhu, E., Clinton, N., Maiman, S., Shaikh, A., Macfarlane, W. W., et al. (2023). EEAGER: A neural network model for finding beaver complexes in satellite and aerial imagery. Journal of Geophysical Research: Biogeosciences, 128, e2022JG007196. https://doi.org/10.1029/2022JG007196
  • Complete CFU 5.5 | Environmental Engineers
Looking Ahead
​
Don't be sad this class is over, be happy you were here to experience it! Next class we will be shifting our focus to the addition of species and the effect they can have on an ecosystem.
Module 5.6 | Invasive Species
Introduction
​
As we've been looking at, an ecosystem is often a delicate balance of biodiversity and maintaining that biodiversity is important. Adding a species that is not otherwise from there (a non-native species) can tip the ecosystem in a wrong direction as well. Today we'll be looking at invasive species and the effect they can have.
Today's Objective
  • Students will learn about the ecological effects of invasive species on an ecosystem and create a storymap about a case studies species.
    • Central Question: Why is the introduction of non-native species to an ecosystem harmful?
    • Geographic Practice: Inform or persuade an audience using geographic principles, models, and data.
Today's Checklist
  • Complete Forum 5.6 | Not Supposed to Be Here
    • IDENTIFY and DESCRIBE 5 negative impacts that the introduction of a non-native species could have on an ecosystem.
  • Participate in Invasive Species notes
    • Description: As a class we will go over the Invasive Species notes.
  • Discuss Invasive Species 101 video
    • Description: To help build context and explain further we will watch the National Geographic video Invasive Species 101 and discuss.
  • Work on Invasive Species Storymap 
    • Description: Create a story map about an invasive species of your choice. Include the following elements in your story map;
    • Include a map of the species native range and where it is presently invasive
    • What are the positive and negative effects the species has had on the area
    • How did the species get to where it is now (how/why was it introduced?)
    • What management techniques are being used to try to deal with the species?
    • Include maps and visuals to build a story map of the information about the species.
    • Make sure to include your sources in APA format at the bottom.
    • Suggested Species:| Alaskan Lupine (Iceland), Yellow Sweet Clover (South Dakota), Red Cedar (Nebraska), Chokecherry (Alaska), Garlic Mustard (Minnesota), Eurasian water-milfoil (Wisconsin)
      You will submit the link to your story map as question 1 of the CFU
      For an example (this is far and above what is expected for you) you can check out the story map of Nebraska's Aquatic Invasive Species created by Zoo Academy student Sophia W. that won 1st place in the Nebraska Story Map competition.
  • Complete CFU 5.6 | Invasive Species
Looking Ahead
​
Next class we'll look at invasive species further and examine how they can lead to trophic cascades of their own.
Module 5.7 | Invasive Species Trophic Cascades
Introduction
​
Building on the ideas of invasive species, we're going to be looking at invasive species and their effects and management techniques just here in the United States.
Today's Objective
  • Students will analyze critical effects of the introduction of invasive species on an ecosystem and the distributions of native species by looking at case studies. 
    • Central Question: What impact can the introduction of new species have on an ecosystem?
    • Geographic Practice: Identify problems or questions that can be addressed using geographic principles, models, and data; express problems and questions in geographic terms
Today's Checklist
  • Complete Forum 5.7 | Pest Control
    • Guiding Thought Question: While working as a state forestry specialist you notice the growth of a non-native weed start growing in your conservation area. As the weed spreads further local farmers introduce non-native rabbits to the area that are known to feed on the plants to protect their crops from the encroaching weeds, but they quickly multiply and start eating other plants as well, resulting in numbers on non-native rabbits decreasing. How do you address the issue? What recommendations do you make?
  • Examine the USGS' RIIS
    • Description: Read through the information on the Register of Introduced and Invasive Species (RIIS) story map produced by the USGS and be prepared to discuss the following questions.
    • Why would the U.S. government have an interest in tracking invasive species?
    • How can a registry like RIIS be useful in the management of species?
    • How do biogeographers contribute to efforts to manage invasive species?
    • Develop an inquiry question that could lead to a further investigation of invasive species across the United States.
  • Discuss how the U.S. is taking the approach of managing different invasive species
    • Description: For each of the following species do some internet reading and answer the series of questions (answer each question for each species). You're focusing on the impact that the species have on an ecosystems and the ways to manage those issues.
      Species:
    • Hogs in Texas
    • Burmese Pythons in the Everglades
    • Silver Carp in the Missouri River
    • Lion Fish in Florida reefs
    • Domestic Cats across the United States
    • European Starling in the United States
    • Norway Rat in Hawaii
    • Questions:
    • How did the species get introduced in the U.S.?
    • What impact have they had on the ecosystem?
    • How are they being managed? Explain to the degree that these efforts have been successful.
  • Complete CFU 5.7 | Invasive Species Trophic Cascade
Looking Ahead
​
We've been focusing on the impact of the addition of species to a landscape, next we'll be look at the impact of the removal of species from an ecosystem (or all together completely remove from the landscape).
Module 5.8 | The song of the dodo
Introduction
​
Species are disappearing at an alarming rate. The sometimes literal canaries are warning us there is danger, so what can we do to stop them? Today's lesson will focus on what is happening, and what can be done.
Today's Objective
  • Students will learn about the importance of preserving species and making a case for the continued protection of all by designing informative
    • Central Question:  What does the planet lose when a species goes extinct?
    • Geographic Practice: Inform or persuade an audience using geographic principles, models, and data.
Today's Checklist
  • Complete Forum 6.3 | Existential Threat
    • Guiding Thought Question: In your opinion, what is the largest threat to biodiversity on the planet? Explain your reasoning.
  • Participate in a Threat to Existence field lab
    • Description: Head to the Kingdom of the Night and choose a specific species. Answer the following questions about your species of choice.
    • Describe all of the environmental factors that could cause your species to become extinct.
    • Describe all of the biological factors that could cause your species to become extinct.
    • Describe all of the anthropogenic factors that could cause your species to become extinct. 
  • Discuss videos in Humans as Destructors and Protectors 
    • Watch the Video Why Dodos Actually Went Extinct by Atlas Pro and be ready to discuss the following ideas.
    • Anthropogenic and Natural forces that lead to animal extinction
    • The reasons why islands are so especially prone to species extinction
    • Watch the TEDx Video Beautiful Photos of Animals Facing Extinction by Joel Satore and be ready to explain the following ideas.
    • Ways that humans can work to prevent extinction
      • Specifically - how can awareness lead to action?
  • Complete CFU 5.8 | Song of the Dodo
Looking Ahead
​
We'll continue our look at endangered and extinct species with case studies and building a case for protection.
Module 5.9 | Extinctions and the connection to geographic factors
Introduction
​
Continuing our look at extinction, students will be looking at a case study endangered species and building a argument for why that species needs to be protected. 
Today's Objective
  • Students will learn about the importance of preserving species and making a case for the continued protection of all by designing informative
    • Central Question: What does the world lose when a species goes extinct?
    • Geographic Practice: Inform or persuade an audience using geographic principles, models, and data. ​
Today's Checklist
  • Complete Forum 5.9 | An Anthropogenic Crisis
    • Guiding Thought Question: Watch the video We Need Immediate Action to Stop the Climate Crisis by the British Broadcasting Corporation and DESCRIBE the ways in which humans are driving the increase in the extinction rate.
  • Work on Before They Map Lab
    • Description: Create a Storymap highlighting a critically endangered species. Your focus is trying to highlight the importance of the species and why people should care (to the point of action).
      Include the following elements in your Story Map.
    • Species Common and Scientific Names
    • Photo of the animal (from the Photo Ark if Possible)
      • Add a caption that includes a photo reference (add citation at the bottom in APA format)
    • Map of the animal's range (Historic and Present)
      • Present ranges will be available through the IUCN Redlist (add as a .shp), Historic ranges will probably have to be drawn as map notes
    • Conservation Status and Current Population Trend (From the IUCN Redlist)
    • Bulleted Reason for their status
      • Description of why they're endangered not just listing (example BAD: Deforestation, GOOD: Destruction of their forest habitat for expansion due illegal logging for agriculture.)
      • Cite your sources used at the bottom in APA
    • Paragraph why they are worth protecting
      • Talking about the ecological importance of the animal
      • Connect in potential changes to landscape and food web (Some might need to consider trophic effects)
    • Bulleted List of ways that people/organizations/governments are trying to help the species
      • Descriptions, not just identifying
    • You will submit the link to your Story Map as question 1 of the CFU.
  • Complete CFU 5.9 | Extinctions as a Function of Geography
Looking Ahead
​
Next class we'll have a prep day to get ready for the end of unit skills and content evaluation. You'll want to be reviewing materials related to extinctions, invasive species, and biodiversity 
Module 5.10 | Exam Prep Day
Introduction
​
Today's class will serve as a chance for students to prep for the upcoming end of unit exam and catch up on any missing CFUs.
Today's Objective
  • Students will review the concepts covered from throughout the course of the unit and be ready to answer questions related to them on the end of unit exam.
    • Central Question: How are the concepts of biodiversity, extinction, invasive species, and trophic cascades understood within the field of biogeography?
Today's Checklist
  • Work on End of Unit Review
Looking Ahead
​
Next class we'll have the end of Unit Test. It is similarly formatted to other tests where it is all short answer based. You will have the whole next class to work on it.
Module 5.11 | Unit V Exam
Introduction
​
Welcome to the end of Unit V | Maintaining Populations and Biodiversity. We will celebrate this occasion with your end of unit skills and content evaluation. 
Today's Objective
  • Students will demonstrate their knowledge of concepts related to biogeography and how they are connected to the physical landscape. 
    • Central Question: What is the relationship between biological species and their physical location? ​
Today's Checklist
  • Complete Unit V Skills and Content Evaluation
Looking Ahead
​
We've made it to the end of Unit V and will be moving along to Unit VI. The next unit will focus on applied biogeography and the actual skills, jobs, and careers connected to the field as a whole. 

Unit V Review

  • Keystone Species
  • Trophic Cascade
  • Biodiversity
  • Diversification
  • Biodiversity Hotspot
  • Extinction 
    • Anthropogenic and natural reasons for..
    • Influence of climate change
  • Variation
  • Genetic Diversity
  • Endangered Species
  • Apex Predator
  • Environmental Engineer
  • Invasive Species
    • Reasons for, effects of, management techniques

Unit VI | Applied Biogeography

Students will be using their understanding of biogeographic concepts to better understand a species by completing a guided geoinquiry. By going through the process of asking a geographic question, collecting data, visualizing and analyzing it, and developing an action plan for its preservation students will be able to better understand the applications of biogeography for their future career interests

Unit VI Schedule

Module 6.1 | Name
Module 6.2a | Name
Module 6.2b | Name
Module 6.3 | Name
Module 6.4 | Name
Module 6.5 | Name
Module 6.6 | Name
Module 6.7a | Name
Module 6.7b | Name
Module 6.7c | Name

Unit X - Applied Biogeography

Unit III Schedule

Week 16: Tools of the Biogeographer
     (Nov 28-Dec 2) 
Module 3.1: Ways We Study Life
     Central Question: How can biogeographers                 actually capture and study data?
     Forum: Work of the Biogeographer (3.1)
     - Tagging and Tracking
​          + Does Jane Goodall use GIS?
          + Tracking the Movement of Denali's Wolves
​
          + WWF Species Tracker: Svalbard Polar Bears
     - Capturing Visual Record
          + Fluke ID Catalog
          + TED Talk: Paul Nicklen 
          + Botswana Wildlife Watch
Week 17: Biogeographic Geoinquiry
     (Dec 10-14) 
Module 3.6: Organizing Data
     Central Question: What are effective ways of             communicating data?
     
Forum: Advantages of Visualizations (3.6)
     - Biogeographic Geoinquiry (Assignment)
          + ESRI: ArcGIS
     Benchmark: All parts of Ask, Acquire, and                 Organize should be completed ​for next class
Module 3.7: Analysis and Action Plan
     Central Question: Once you've got information           together what do you do with it?
     
Forum​: Next Steps (3.7)
​     - Biogeographic Geoinquiry (Assignment)
     Deliverable: Project Submission
          (All projects must be submitted by 11:59 p.m.              on Tuesday, December 18th, 2018) 
Week 17: Mapping Biogeography
     (Dec 5-9) 
Module 3.2: Remote Field Study
     Central Question: How can modern technology           be used for biogeographic studies?
     Forum: Modern Mapping (3.2)
     Map Lab: Bamboo Lemur Field Study 
          + Kianjavato Ahmanson Field Station
          + ESRI: ArcGIS
     Homework: John Grehan: Panbiogeography             Method (Read Thoroughly)
Module 3.3: Panbiogeography
     Central Question: How can geographic analysis         be used to discover spatial relationships between       taxa?
     
Forum: More of Biology or Geography? (3.3)
​     - Panbiogeography Methods (Notes)
     Map Lab: Panbiogeographic Rhinocerotidae
​          + Example Map
          + ESRI: ArcGIS
          - IUCN Red List
     - Panbiogeographic Relationships (Assignment)
Picture
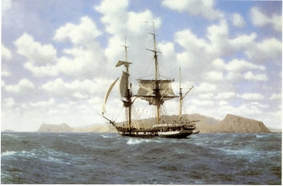
Week 18: Biogeographic Geoinquiry
     (Dec 12-16) 
Module 3.4: Formulate Geographic Question
     Central Question: How can geography be used to       address issues in the natural world? 
     
Forum: Elements of a Geographic Question (3.4)
     - Biogeographic Geoinquiry (Assignment)
​          + Project overview and requirements
          + Part 1: Ask
     Deliverable: Final Geoinquiry Question
Module 3.5: Collect and Organize Data
     Central Question: What type of data do you need       to answer a geographic question?
     
Forum​: Identifying Reputable Sources (3.5)
     - Biogeographic Geoinquiry (Assignment)
​          + Data Collection
          Field Lab: Student Choice
     Benchmark: Ready to Organize Next Class
Week 18: Present Findings
     (Dec 17-21) 
Module 3.8: Project Work Day
     Central Question: What ties research together in       the better understanding of our planet? 
     Forum: Purpose of Research (3.8)
​​     - Biogeographic Geoinquiry (Assignment)
     - Student Survey
     Deliverable: Project Submission
Module 3.9: Project Presentations
     Central Question: When is research not enough         and how can it be used to solve a problem?
     
Forum​: Quality of Research (3.9)
​​     - Biogeographic Geoinquiry (Assignment)
     Deliverable: Project Submission

Unit III Checks for Understanding

CFU 3.1
CFU 3.2
CFU 3.3
CFU 3.4

Unit III Notes

Panbiogeography Methods (Module 3.3)

Unit III Resources

Quizziz 
For More Wonder, Re-Wild the World
Picture
Picture
Picture
Picture
Picture
Picture

Unit III Assignments

Bamboo Lemur Geoinquiry
File Size: 1588 kb
File Type: pdf
Download File

gblemur_shapefile.zip
File Size: 590 kb
File Type: zip
Download File

prolemur_simus_e2_2017.csv
File Size: 67 kb
File Type: csv
Download File

Biogeographic Geoinquiry
File Size: 431 kb
File Type: pdf
Download File

Panbiogeographic Relationships
File Size: 180 kb
File Type: pdf
Download File

Panbiogeography Rhinocerotidae
File Size: 151 kb
File Type: pdf
Download File


Biogeography Course Resources

Biogeography Resources

Biogeography Index
File Size: 668 kb
File Type: pdf
Download File

Biogeography Syllabus (22-23)
File Size: 1545 kb
File Type: pdf
Download File

Conducting Field Studies
File Size: 376 kb
File Type: pdf
Download File

EBook: Fundamentals of Biogeography

Biogeography Forum

Picture

Biogeography Internet Resources

Picture
Picture
Picture
Picture
Picture
Picture
Picture
Picture
Picture
Picture
Picture
Picture
Biome Viewer
Earth Viewer
Picture
Picture
Powered by Create your own unique website with customizable templates.